Chapter Contents
Previous
Next
|
Chapter Contents |
Previous |
Next |
| The LOESS Procedure |
The following data from the Connecticut Tumor Registry presents age-adjusted numbers of melanoma incidences per 100,000 people for 37 years from 1936 to 1972 (Houghton, Flannery, and Viola, 1980).
   data Melanoma;
      input  Year Incidences @@;
      format Year d4.0;
      format DepVar d4.1;
   datalines;
   1936    0.9   1937   0.8  1938   0.8  1939   1.3
   1940    1.4   1941   1.2  1942   1.7  1943   1.8
   1944    1.6   1945   1.5  1946   1.5  1947   2.0
   1948    2.5   1949   2.7  1950   2.9  1951   2.5
   1952    3.1   1953   2.4  1954   2.2  1955   2.9
   1956    2.5   1957   2.6  1958   3.2  1959   3.8
   1960    4.2   1961   3.9  1962   3.7  1963   3.3
   1964    3.7   1965   3.9  1966   4.1  1967   3.8
   1968    4.7   1969   4.4  1970   4.8  1971   4.8
   1972    4.8
   ;
The following PROC GPLOT statements produce the simple scatter plot of these data displayed in Figure 38.1.
   symbol1 color=black value=dot ;
   proc gplot data=Melanoma;
      title1 'Scatter Plot of Melanoma Data';
      plot Incidences*Year;
   run;

|
Suppose that you want to smooth the response variable Incidences as a function of the variable Year. The following PROC LOESS statements request this analysis:
   proc loess data=Melanoma;
      model Incidences=Year/details(OutputStatistics);
   run;
You use the PROC LOESS statement to invoke the procedure and specify the data set. The MODEL statement names the dependent and independent variables. You use options in the MODEL statement to specify fitting parameters and control the displayed output. For example, the MODEL statement option DETAILS(OutputStatistics) requests that the "Output Statistics" table be included in the displayed output. By default, this table is not displayed.
The results are displayed in Figure 38.2 and Figure 38.3.
| ||||||||||||||||||||||
Usually, such displayed results are of limited use. Most frequently the results are needed in an output data set so that they can be displayed graphically and analyzed further. For example, to place the "Output Statistics" table shown in Figure 38.2 in an output data set, you use the ODS OUTPUT statement as follows:
   proc loess data=Melanoma;
      model Incidences=Year;
      ods output OutputStatistics=Results;
   run;
The statement
ods output OutputStatistics=Results;
requests that the "Output Statistics" table that appears in
Figure 38.2 be placed in a SAS data set named Results. Note also that the
DETAILS(OutputStatistics) option that caused this table to be included
in the displayed output need not be specified.
The PRINT procedure displays the first five observations of this data set:
   title1 'First 5 Observations of the Results Data Set';
   proc print data=Results(obs=5);
     id obs;
   run;
|
You can now produce a scatter plot including the fitted loess curve as follows:
   symbol1 color=black value=dot;
   symbol2 color=black interpol=join value=none;

   /* macro used in subsequent examples */
   %let opts=vaxis=axis1 hm=3 vm=3 overlay;

   axis1 label=(angle=90 rotate=0);

   proc gplot data=Results;
     title1 'Melanoma Data with Default LOESS Fit';
     plot  DepVar*Year Pred*Year/ &opts;
   run;

|
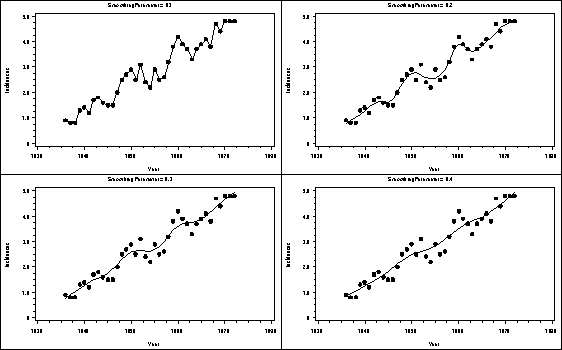
The loess fit shown in Figure 38.5 was obtained with the default value of the smoothing parameter, which is 0.5. It is evident that this results in a loess fit that is too smooth for the Melanoma data. The loess fit captures the increasing trend in the data but does not reflect the periodic pattern in the data, which is related to an 11-year sunspot activity cycle. By using the SMOOTH= option in the MODEL statement, you can obtain loess fits for a range of smoothing parameters as follows:
   proc loess data=Melanoma;
      model Incidences=Year/smooth=0.1 0.2 0.3 0.4 residual;
      ods output OutputStatistics=Results;
   run;
The RESIDUAL option causes the residuals to be added to the "Output Statistics" table. PROC PRINT displays the first five observations of this data set:
   proc print data=Results(obs=5);
     id obs;
   run;
|
Note that the fits for all the smoothing parameters are placed in single data set and that ODS has added a SmoothingParameter variable to this data set that you can use to distinguish each fit.
The following statements display the loess fits obtained in a 2 by 2 plot grid:
   goptions  nodisplay;
   proc gplot data=Results;
      by SmoothingParameter;
      plot DepVar*Year=1 Pred*Year/ &opts name='fit';
   run; quit;

   goptions display;
   proc greplay nofs tc=sashelp.templt template=l2r2;
       igout gseg;
       treplay 1:fit 2:fit2 3:fit1 4:fit3;
   run; quit;
|
If you examine the plots in Figure 38.7, you see that a good fit is obtained with smoothing parameter 0.2. You can gain further insight in how to choose the smoothing parameter by examining scatter plots of the fit residuals versus the year. To aid the interpretation of these scatter plots, you can again use PROC LOESS to smooth the response Residual as a function of Year.
   proc loess data=Results;
      by SmoothingParameter;
      ods output OutputStatistics=residout;
      model Residual=Year/smooth=0.3;
   run;

   axis1 label = (angle=90 rotate=0)
         order = (-0.8 to 0.8 by 0.4);
   goptions nodisplay;
   proc gplot data=residout;
      by SmoothingParameter;
      plot  DepVar*Year Pred*Year / &opts vref=0 lv=2 vm=1
                                    name='resids';
   run; quit;

   goptions display;
   proc greplay nofs tc=sashelp.templt template=l2r2;
       igout gseg;
       treplay 1:resids 2:resids2 3:resids1 4:resids3;
   run; quit;

|
Looking at the scatter plots in Figure 38.8 confirms that the choice of smoothing parameter 0.2 is reasonable. With smoothing parameter 0.1, there is gross overfitting in the sense that the original data are exactly interpolated. The loess fits on the Residual versus Year scatter plots for smoothing parameters 0.3 and 0.4 reveal that there is a periodic trend in the residuals that is much weaker when the smoothing parameter is 0.2. This suggests that when the smoothing parameter is above 0.3, an overly smooth fit is obtained that misses essential features in the original data.
Having now decided on a loess fit, you may want to obtain confidence limits for your model predictions. This is done by adding the CLM option in the MODEL statement. By default 95% limits are produced, but this can be changed by using the ALPHA= option in the MODEL statement. The following statements add 90% confidence limits to the Results data set and display the results graphically:
   proc loess data=Melanoma;
      model Incidences=Year/smooth=0.2 residual clm
                            alpha=0.1;
      ods output OutputStatistics=Results;
   run;

   symbol3 color=green interpol=join value=none;
   symbol4 color=green interpol=join value=none;
   axis1 label = (angle=90 rotate=0)
         order = (0 to 6);
   title1 'Age-adjusted Melanoma Incidences for 37 Years';


   proc gplot data=Results;
     plot  DepVar*Year Pred*Year LowerCl*Year UpperCL*Year
                        /  &opts;
   run;

|
|
Chapter Contents |
Previous |
Next |
Top |
Copyright © 1999 by SAS Institute Inc., Cary, NC, USA. All rights reserved.