Chapter Contents
Previous
Next
|
Chapter Contents |
Previous |
Next |
| The LOGISTIC Procedure |
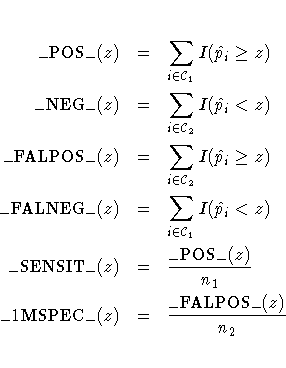
Suppose the n individuals undergo a test for predicting the event and the test is based on the estimated probability of the event. Higher values of this estimated probability are assumed to be associated with the event. A receiver operating characteristic (ROC) curve can be constructed by varying the cutpoint that determines which estimated event probabilities are considered to predict the event. For each cutpoint z, the following measures can be output to a data set using the OUTROC= option:

Note that _POS_(z) is the number of correctly predicted event responses, _NEG_(z) is the number of correctly predicted nonevent responses, _FALPOS_(z) is the number of falsely predicted event responses, _FALNEG_(z) is the number of falsely predicted nonevent responses, _SENSIT_(z) is the sensitivity of the test, and _1MSPEC_(z) is one minus the specificity of the test.
A plot of the ROC curve can be constructed by using the PLOT or GPLOT procedure with the OUTROC= data set and plotting sensitivity (_SENSIT_) against 1-specificity (_1MSPEC_). The area under the ROC curve, as determined by the trapezoidal rule, is given by the statistic c in the "Association of Predicted Probabilities and Observed Responses" table.
|
Chapter Contents |
Previous |
Next |
Top |
Copyright © 1999 by SAS Institute Inc., Cary, NC, USA. All rights reserved.