| The SURVEYMEANS Procedure |
Statistical Computation
The SURVEYMEANS procedure uses the Taylor expansion
method to estimate sampling errors of estimators based
on complex sample designs. This method obtains a
linear approximation for the estimator and then uses
the variance estimate for this approximation to
estimate the variance of the estimate itself (Woodruff
1971, Fuller 1975). When there are clusters, or PSUs,
in the sample design, the procedure estimates variance
from the variation among PSUs. When the design is
stratified, the procedure pools stratum variance
estimates to compute the overall variance estimate.
For t tests of the estimates, the degrees of
freedom equals the number of clusters minus the number
of strata in the sample design.
For a multistage sample design, the variance estimation
method depends only on the first stage of the sample
design. So, the required input includes only
first-stage cluster (PSU) and first-stage stratum
identification. You do not need to input design
information about any additional stages of sampling.
This variance estimation method assumes that the
first-stage sampling fraction is small, or the
first-stage sample is drawn with replacement, as it
often is in practice.
For more information on the analysis of sample survey
data, refer to Lee, Forthoffer, and Lorimor (1989),
Cochran (1977), Kish (1965), and Hansen, Hurwitz, and
Madow (1953).
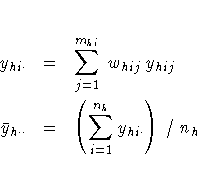
For a stratified clustered sample design,
together with the sampling weights, the sample can be
represented by an n ×(P+1) matrix

where
- h = 1, 2, ... , H is the stratum number, with a total of
H strata
- i = 1, 2, ... , nh is the cluster number within stratum h,
with a total of nh clusters
- j = 1, 2, ... , mhi is the unit number within cluster i
of stratum h, with a total of mhi units
- p = 1, 2, ... , P is the analysis variable number, with a
total of P variables
-
 is the
total number of observations in the sample
is the
total number of observations in the sample
- whij denotes the sampling weight for observation
j in cluster i of stratum h
- yhij = ( yhij(1), yhij(2), ... , yhij(P))
are the observed values of the analysis
variables for observation j in cluster i of
stratum h, including both the values of
numerical variables and the values of indicator
variables for levels of categorical variables.
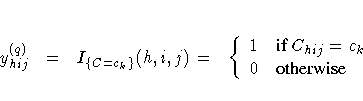
For a categorical variable
C, let l denote the
number of levels of C, and denote the level values
as c1, c2, ... , cl. Then there are l
indicator variables
associated with these levels.
That is, for level C=ck (k = 1, 2, ... , l), a
y(q)  contains the
values of the indicator variable for the category
C=ck, with the value of observation j in cluster
i of stratum h:
contains the
values of the indicator variable for the category
C=ck, with the value of observation j in cluster
i of stratum h:
Therefore, the total number of analysis variables, P, is the
total number of numerical variables plus the total
number of levels of all categorical variables.
Also, fh denotes the sampling rate for stratum h.
You can use the TOTAL= option or the RATE= option to
input population totals or sampling rates. See
the section "Specification of Population Totals and Sampling Rates" for details. If you input stratum
totals, PROC SURVEYMEANS computes fh as the ratio of
the stratum sample size to the stratum total. If you
input stratum sampling rates, PROC SURVEYMEANS uses
these values directly for fh. If you do not specify
the TOTAL= option or the RATE= option, then the
procedure assumes that the stratum sampling rates fh
are negligible, and a finite population correction is
not used when computing variances.
This notation is also applicable to other sample
designs. For example, for a sample design without
stratification, you can let H=1; for a sample design
without clusters, you can let mhi=1 for every h
and i.
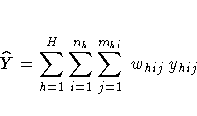
When you specify the keyword MEAN, the procedure
computes the estimate of the mean (mean per element)
from the survey data. Also, the procedure computes
the mean by default if you do not specify any
statistic-keywords in the PROC SURVEYMEANS statement.
PROC SURVEYMEANS computes the estimate of the mean as
where

is the sum of the weights over all observations
in the sample.
When you specify the keyword STDERR, the procedure
computes the standard error of the mean. Also, the
procedure computes the standard error by default if
you specify the keyword MEAN, or if you do not specify
any statistic-keywords in the PROC SURVEYMEANS
statement. The keyword VAR requests the variance of
the mean.
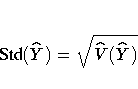
PROC SURVEYMEANS uses the Taylor series expansion
theory to estimate the variance of
the mean  . The procedure computes the estimated variance as

where

The standard error of the mean is the square root of
the estimated variance.

If you specify the keyword T, PROC SURVEYMEANS
computes the t value for testing that the
population mean equals zero,  . The
test statistic equals
. The
test statistic equals

The
two-sided p-value for this test is

where T
is a random variable with the t distribution
with df degrees of freedom.
PROC SURVEYMEANS calculates the degrees of freedom
for the
t test as the number of clusters minus the number of
strata. If there are no clusters, then df equals
the number of observations minus the number of strata.
If the design is not stratified, then df equals the
number of clusters minus one.
The procedure displays df for the t
test if you specify the keyword DF in the PROC
SURVEYMEANS statement.
If you specify the keyword CLM, the procedure computes
confidence limits for the mean. Also, the procedure includes
the confidence limits by default if you do not specify any
statistic-keywords in the PROC SURVEYMEANS statement.
The confidence coefficient is determined by the
value of the ALPHA= option, which by
default equals 0.05 and produces 95% confidence
limits. The confidence limits are computed as
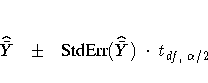
where is the estimate of the mean,
 is the standard error
of the mean, and
is the standard error
of the mean, and  is the
  percentile of the t distribution with df calculated
as described in the section "t Test for the Mean" .
percentile of the t distribution with df calculated
as described in the section "t Test for the Mean" .
Coefficient of Variation
If you specify the keyword CV, PROC SURVEYMEANS computes
the coefficient of variation, which is the ratio of the
standard error of the mean to the estimated mean.

Proportions
If you specify the keyword MEAN for a categorical
variable, PROC SURVEYMEANS estimates the proportion,
or relative frequency, for each level of the
categorical variable. If you do not specify any
statistic-keywords in the PROC SURVEYMEANS statement,
the procedure estimates the proportions for levels
of the categorical variables, together with their
standard errors and confidence limits.
The procedure estimates the proportion in level ck
for variable C as

where yhij(q) is value of the
indicator function for level C=ck, defined in
the section "Definitions and Notation", yhij(q) equals 1 if
the observed value of variable C equals ck, and
yhij(q) equals 0 otherwise. Since the
proportion estimator is actually an estimator of the
mean for an indicator variable, the procedure computes
its variance and standard error according to the
method outlined in the section "Variance and Standard Error of the Mean". Similarly, the
procedure computes confidence limits for proportions
as described in the section "Confidence Limits for the Mean".
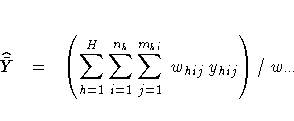
If you specify the keyword SUM, the procedure
computes the estimate of the population total from
the survey data. The estimate of the total is
the weighted sum over the sample.
For a categorical variable level,  estimates its total frequency in the population.
When you specify the keyword STD or the keyword SUM,
the procedure estimates the standard deviation of the
total. The keyword VARSUM requests the variance of
the total.
estimates its total frequency in the population.
When you specify the keyword STD or the keyword SUM,
the procedure estimates the standard deviation of the
total. The keyword VARSUM requests the variance of
the total.
PROC SURVEYMEANS estimates the variance of the total as

where
The standard deviation of the total equals
Confidence Limits of a Total
If you specify the keyword CLSUM, the procedure
computes confidence limits for the total. The
confidence coefficient is determined by the value
of the ALPHA= option, which by
default equals 0.05 and produces 95%
confidence limits. The confidence limits are
computed as

where is the estimate of the total,
 is the estimated standard
deviation, and is the
percentile of the t
distribution with df calculated as described
in the section "t Test for the Mean".
is the estimated standard
deviation, and is the
percentile of the t
distribution with df calculated as described
in the section "t Test for the Mean".
Copyright © 1999 by SAS Institute Inc., Cary, NC, USA. All rights reserved.