Carbon Dioxide Emissions
Co2e - Carbon dioxide equivalent (CO2 e) expresses the impact of each different greenhouse gas in terms of the amount of CO2 (carbon dioxide) that would create the same amount of warming. This enables reporting total CO2 greenhouse gas emissions in one measurement.
Private and Commercial Vehicles
Data requirements included Vehicle Kilometers Traveled (VKT), number of vehicles per class, average mileage for each vehicle class, and emissions factors for each vehicle class. Data for 2012, including VKTs, was available through the Province of BC’s CEEI. Average VKTs were multiplied by the total number of vehicles and average fuel consumption for each vehicle class.
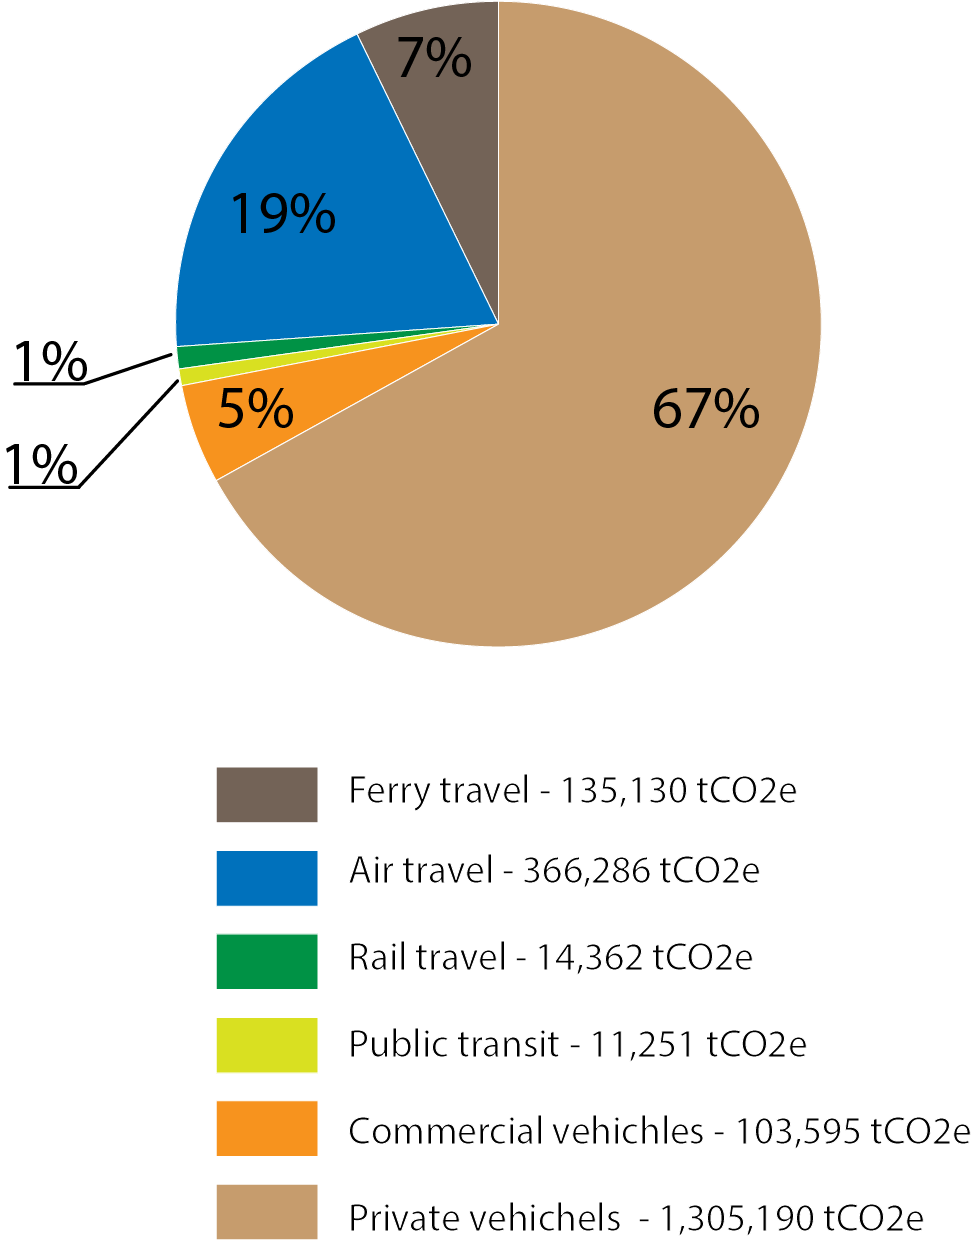
Air Travel
Distance and Emission Calculation
The Great Circle Distance was used to estimate flight distances to and from each destination using the World Airport Codes web tool. For cities with multiple airports that did not specify the specific airport, the largest airport for the city was used. These flight distances were then multiplied by the number of passengers by seat class per destination to estimate total passenger-kilometers by flight and seat classification. Then, air emission factors based on flight distance and seat class from the United Kingdom Department for Environment, Food & Rural Affairs (UK DEFRA) were applied to convert passenger kilometers to tCO2e (UK DEFRA, 2016).
Metro Vancouver Residential Scale Factor
Finally, a load factor of 0.20 was used to scale YVR’s total flights for Metro Vancouver Residents. YVR demographic analysis from 2015 indicates that approximately 20% of flights are attributable to Metro Vancouver residents (J. Aldcroft, Manager, Environment, YVR, personal communication, August 22, 2017). Total residential emissions were divided by Metro Vancouver’s population to generate per-capita air emission averages, which are multiplied by the population for each pilot city to estimate tCO2e associated with residential air travel.
Green Transportation plan
Goal: Make walking, Cycling and public transport preferred options.
Annual Kilometers Driven Per Person
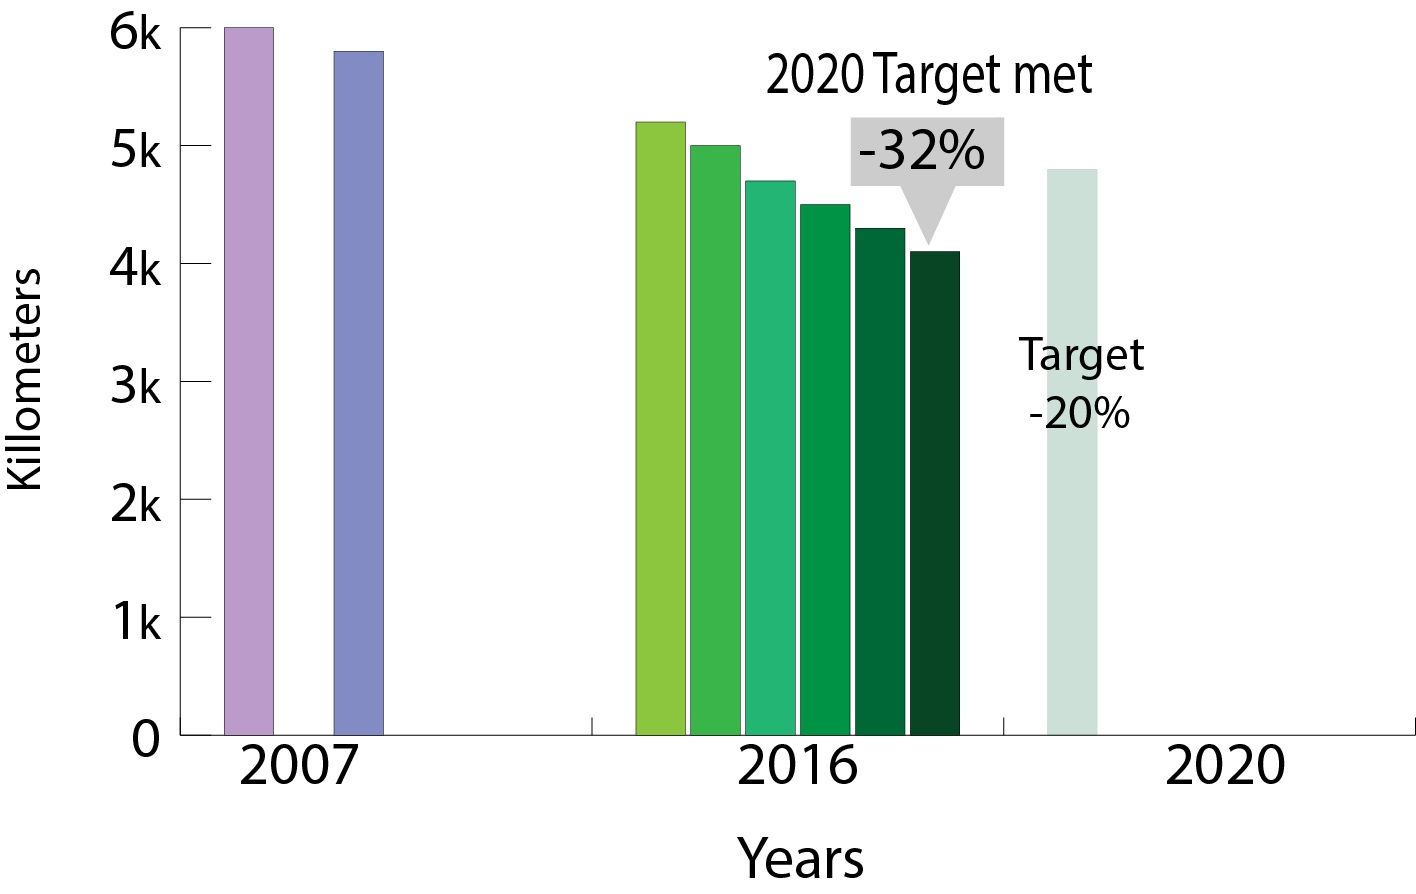
2020 targets: 1) Majority (>50%) of trips by foot, bicycle and public transport. 2) Reduce average distance driven per resident by 20% from 2007 levels.
Transport by Walking, Biking, or Transiting

It is important to contextualize the results with the knowledge that Vancouver’s per capita footprint and GHG emissions are likely higher than that of neighbouring communities since the city functions as a regional service centre. Residents from neighbouring communities travel to Vancouver for work and entertainment generating waste and using energy, as do the many tourists. To illustrate this point, we know that about twenty five percent of the regional population resides in Vancouver, but the City’s contribution to the regional GDP is closer to forty percent.