David S Ebert,
Chris D Shaw,
Amen Zwa
,
Ethan L Miller,
and
D Aaron Roberts
U Maryland
Baltimore County
+
U of Regina
+
U Maryland Baltimore County
NASA GSFC
+
Keywords: volumetric information visualization, minimally-immersive techniques, two-handed interaction, glyph rendering
To find a document in the sea of information, one must embark on a search process, usually aided by computer. If one's goal is to search through a large corpus of documents for the 10 articles most relevant to a single well-defined topic, then a single query yielding a scalar indication of relevance is usually sufficient. In this traditional information retrieval model, the final goal is to identify and collect a small number of documents to read in detail. The remainder of the document corpus is viewed as partially or wholly irrelevant to the task, like so much ore from which gold must be extracted.
By contrast, information analysis or document corpus management seeks to understand what is happening in the collection of documents as a whole. Individual documents may indeed be read or skimmed, but only as a means to gaining a greater understanding of what is happening in the rest of the document set. Information analysis seeks to identify trends, discover common linkages, and find clusters of similar documents. In this situation, the results of many single queries must be combined in various ways so that trends may be discovered. Document corpus management therefore shares some of the goals of Data Mining, or Knowledge Discovery from Data [11], which is the nontrivial extraction of implicit, previously unknown, and potentially useful information from data.
This paper describes a new system that aids in the document corpus management task by employing 3D volumetric visualization techniques in a minimally-immersive real-time interaction style. An intuitive two-handed interaction metaphor [20,12] is created using three-space magnetic trackers. This two-handed interaction, in combination with stereo-viewing, provides a minimally-immersive system that increases the user's three-dimensional perception of the information space. Glyph-based volume visualization [10] and hardware acceleration techniques are used to provide interactive rendering speeds for multivariate time-varying information spaces.
Most systems for information visualization to date have been 2D or surface-based (e.g., [2,7,14,18,22,23]. Many of these systems provide useful visualization tools and are good for showing two-dimensional relationships. Some can show the relationship among three parameters of the information space. For example, the SPIRE system [22] shows the similarity among topics in an information space projected onto two dimensions. The frequency of documents within a topic is displayed graphically by the height of mountains in their Themescapes component, creating a landscape of document topics. However, to understand complex multi-dimensional relationships, users must mentally fuse several two-dimensional images.
These 2D and surface-based systems, however, fail to capitalize on the human perception system's ability to understand full three-dimensional volumetric space. With volume visualization and careful mapping of information to visualization attributes, more dimensions of the information space can be perceived than with two-dimensional surfaces.
To visualize the volumetric data, our system uses glyph rendering, displaying a small shape (glyph) at each location within the three-dimensional volume. Glyph, or iconic, visualization is an attempt to comprehensibly encode more information in the visualization [17,19] and is an extension to the use of glyphs and icons in fields like cartography and statistics. The use of 3D glyph visualization allows the user to visually compare the results of 6 or more queries as they apply to the entire document set. For each document, the results of three of these queries determine the location of a glyph, while the remaining queries are assigned to glyph size, color, opacity, and shape. This system is, therefore, capable of visualizing complex multi-dimensional relationships vital to information analysis and document corpus management.
In The Elements of Graphing Data [8], Cleveland cites experimental evidence that shows the most accurate method to visually decode a quantitative variable is to display position along a scale. This is followed in decreasing order of accuracy by length, slope angle, area, volume, and color. Presumably, opacity would be near the bottom, similar to color. For distinguishing a categorical variable, shape and color can be quite effective. A 3D glyph display provides three scales along which a glyph can be measured, while a 2D display provides only two. Terrain height does contain 3D information, but only a single surface is visible. Translucent surfaces may allow scenes of higher depth complexity, but the third or fourth surface encountered along the line of sight is usually quite indistinct, and, therefore, hard to measure and compare. A 3D glyph display has the unique capability of allowing the most effective methods of visual perception.
Several researchers [5,3,12] have examined the use of virtual reality environments for visualization; however, little work exists on applying these techniques to information visualization. Our two-handed minimally-immersive environment extends the earlier work of Feiner and Beshers [4] to two-handed interaction and volume rendering. Our approach provides interactive three-dimensional volumetric visualization, manipulation, and exploration of multivariate time-varying information spaces, increasing the amount of the information space that can be displayed and perceived when compared to more traditional 2D and surface-based systems.
We have applied these techniques to the visualization of similarities in a document corpus using the Telltale system [16]. Telltale is briefly described first, followed by a description of the new information visualization system we have developed. We then conclude with a discussion of our results in visualizing data from the Telltale system and our future directions for research.
Telltale [16] is a dynamic hypertext environment that provides text indexing via a hypertext-style user interface for text corpora. This indexing is done using statistical techniques based on n-grams --- n character sequences of text --- to create links [9] associating documents that are ``similar''. The only inputs to Telltale's algorithms are the documents to be indexed and the list of ASCII characters that make up words; thus, Telltale works well with text in languages other than English because it does not need stop word lists or other language-dependent features. The use of n-grams rather than words provides an additional benefit: indexing is robust in the face of degradation such as that caused by scanning in text using optical character recognition.
Telltale reads in a document by sliding a window n characters wide
across its text.
During this process, all alphabetic characters are converted to lower
case, non-alphabetic characters are converted to spaces, and multiple
spaces are collapsed into a single space.
For example, the 5-grams in this paragraph would consist of
`` tell'', ``tellt'', ``ellta'', and so on.
This process produces a list of overlapping n-grams that are used to
generate a vector ![]() .
Each element of the vector is calculated by
.
Each element of the vector is calculated by ![]() ,
where
,
where ![]() is the count of n-gram k in document i and
is the count of n-gram k in document i and
![]() is the total n-gram count in document i.
While there are
is the total n-gram count in document i.
While there are ![]() possible unique English n-grams,
experimentation has shown that relatively few of them occur in any
corpus.
For example, a 40 MB collection of articles from the Wall Street
Journal has about 270,000 unique 5-grams (out of a possible total of
possible unique English n-grams,
experimentation has shown that relatively few of them occur in any
corpus.
For example, a 40 MB collection of articles from the Wall Street
Journal has about 270,000 unique 5-grams (out of a possible total of
![]() ), and this number increases very slowly as the
corpus increases in size.
), and this number increases very slowly as the
corpus increases in size.
Telltale also maintains an ``average'' document vector a, called the
centroid, whose elements ![]() are calculated by averaging
are calculated by averaging
![]() over all documents i in the corpus.
The similarity
over all documents i in the corpus.
The similarity ![]() is then calculated by taking the cosine of the
representation vectors after subtracting the centroid:
is then calculated by taking the cosine of the
representation vectors after subtracting the centroid:
The numerator in Equation 1 is the dot product of the
vectors ![]() and
and ![]() , representing documents i and j
respectively.
The denominator in Equation 1, the product of the sum
of squares of each term in the respective vectors, is used to normalize
the result.
Telltale uses several techniques to reduce the time required to
calculate the cosine between a ``base'' document j and each document
in the corpus; the calculation time is linear in the number of
documents added to the number of terms
, representing documents i and j
respectively.
The denominator in Equation 1, the product of the sum
of squares of each term in the respective vectors, is used to normalize
the result.
Telltale uses several techniques to reduce the time required to
calculate the cosine between a ``base'' document j and each document
in the corpus; the calculation time is linear in the number of
documents added to the number of terms ![]() for any
n-gram k that occurs in both documents i and j.
for any
n-gram k that occurs in both documents i and j.
A user wishing to find documents using Telltale starts a search by entering either a set of words describing the desired information or a section of a document that the user considers ``good.'' Telltale then converts the query to an n-gram vector in the same way as it would for a document,
and scores this vector against all documents in the corpus displaying the similarities in ranked order.
The effect of the similarity link computation is that of an associative table of contents. The user provides a sample of the ``content'' of interest and the hypertext engine supplies a list of relevant documents by using the similarity link computation.
This result is achieved because documents about the same subject tend to use the same vocabulary and thus are likely to contain many of the same n-grams. Subtracting the centroid from each document's vector before taking the cosine allows the comparison to occur relative to the ``average'' document in the corpus. This subtraction is similar to removing stop words, but is more flexible.
Rather than the unidimensional list present in the original Telltale, we are experimenting with methods that allow a user to explore a text corpus using two, three or more documents as the ``query.''
The display of multiple information parameters within SFA is achieved in two ways: multiple data files and mappings to glyph attributes. For a given three-dimensional coordinate system, several different data sets can be visualized with respect to the same coordinate system, allowing the comparison of trends among related data sets.
One advantage of glyph rendering is the ability to map characteristics of the information space to attributes of each glyph. The first mapping is to determine the glyph's location. The three-space location of each glyph allows the comparative display of three attributes of the information space. The size and shape of the glyphs can easily encode two or more information attributes. The color of the glyph allows the independent display of one dimension, usually one in which high accuracy of perception is not needed. With just these attributes, six or more dimensions (attributes) of the information space can be easily visualized. Opacity is another glyph attribute that can encode information attributes. Care must be taken in mapping an attribute to the opacity and size of a glyph. Small values of this attribute can make the glyph completely transparent, preventing the comparison of the other attributes for this particular glyph. However, opacity mappings can be very useful to eliminate uninteresting information.
For instance, if the user is only interested in documents in a corpus which talk about U.S. foreign policy, using the similarity to this theme as the opacity of the glyph will aid in discerning the relevant documents. The mapping of information attributes to the glyphs' three-dimensional coordinates can be used in a similar fashion, as can be seen in Figure 4. This figure is a visualization of the relationship of 1833 documents to three themes. A quick examination of the image allows you to identify the 10-20 documents out of 1833 that are of interest.
Upon initialization, SFA presents the user with a 3D rendering of the volume of glyphs, and a few 2D control panels. The 3D volume is enclosed by a wireframe box delineating the coordinate system, with labels indicating the textual attributes that are assigned to the X, Y and Z axes. There is also a legend panel within the 3D scene that lists the complete mapping of text attributes to glyph attributes. The use of vector (Hershey) fonts for this helps maintain a strong 3D impression. SFA supports stereo viewing through the use of Liquid Crystal Shutter Glasses, which most users find to be extremely helpful in generating a 3D impression.
To maintain a fluid interaction when the user is moving the data set, the scene must be animated in real time. SFA sets a minimum update rate of 10 frames per second, which requires certain optimizations to be performed when thousands of documents are to be displayed. To achieve this update rate, SFA only displays partially or fully opaque glyphs, caching these glyphs for quick access. SFA also draws the glyphs in order from largest to smallest, stopping when the 0.1 second time limit is reached. This allows the most visible portion of the volume to be drawn first within the interactive time constraint. This allows good interaction on machines with at least the graphics capability of an SGI Indy.
SFA provides both a traditional two-dimensional mouse-keyboard interface and a two-handed minimally immersive interface. For the traditional two-dimensional interface, several control panels allow the user to control the display, including such attributes as glyph type, the current data file, and the current color and transparency map.
In addition to the 2D interface, SFA has a two-handed minimally immersive interface which uses a pair of 3D magnetic trackers. One of the main justifications for this approach is that complex 3D objects can be more easily manipulated by 3D tracking devices than with a mouse [21], because the user does not have to mentally break down the 3D task into a sequence of 2D operations. The use of a 3D device allows the user to directly manipulate the objects of interest without intermediate steps. Two 3D devices gives the user access to double the spatial bandwidth, since both hands can be employed in parallel to quickly achieve the desired operation.
Figure 1: A user using the two-handed stereo interface to SFA.
The user sits in front of a graphics console that has a screen, keyboard, mouse, and the two 3D sensors. Each 3D sensor, or Bat, has three buttons glued onto the surface, as shown in Figure 2. The user interacts with the system by manipulating the two trackers, and pressing the tracker buttons to invoke operations. Each 3D sensor has a distinct role, with the dominant hand being responsible for picking and manipulation, and the less-dominant hand being responsible for context setting of various kinds. For the sake of rhetorical convenience, we will refer to the dominant hand as the right hand and the less-dominant hand as the left, but the system is ambidextrous because the Polhemus trackers are symmetric and can be handled with equal ease by either hand.

Figure 2: Polhemus sensor with attached buttons.
We chose the minimally-immersive style because it does not isolate the user from accessing information on the desktop or from traditional I/O devices like the screen, keyboard, and mouse. In our document corpus management application, text input is quite important, so ready access to standard text manipulation devices, like the keyboard, is vital.
The simultaneous use of two 3D sensors takes advantage of the user's innate proprioceptive knowledge of where his/her two hands are in space.
In most two-handed tasks, there is a natural division of labor [13], which SFA exploits by assigning the (low-frequency) setting of spatial context to the left hand, and the (high-frequency) selection and picking operations to the right. This division of labour is more than just a slogan for the interface style. In addition to providing a criterion for assigning tasks to hands, involving both hands in this way improves spatial perception. This perception is not provided visually, but is, instead, provided by the means of the user's proprioception [15].
The left hand has two tasks to perform:
Scene orientation is a toggle controlled by left button 3. Pressing button 3 attaches the volume to the left cursor, and pressing it again leaves the volume in place. This clutching mechanism allows the user to spend a large amount of time moving the workpiece around without the burden of continuous button pressure. Thus, the left hand acts as a spatial context setter and sensor, allowing the user to get a better sense of the 3D space.
Button 2 pops up a hierarchical sundial menu [20], as shown in Figure 7, which is controlled by the orientation of the left bat. The menu choices are arrayed on the circular plate of the sundial, each on its own pie-shaped sector. The desired item is picked by pivoting the shadow stick about its base so that the stick's endpoint lies visually in front of the sector.
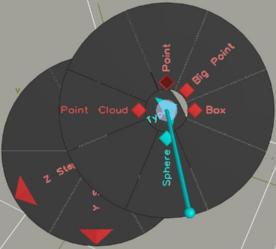
Figure 7: A 3D hierarchical sundial menu.
The user pivots this shadow stick by manipulating the bat's orientation.
This is a pie menu [6] with a 3D selection cursor which encodes the position of the 2D cursor by projecting the 3D position of the endpoint of the shadow stick onto the 2D sundial plate. This main menu in SFA contains a submenu to select the glyph type, a submenu for each of X, Y, and Z step interval selection, and cursor control menu that scales the scene up or down and reorigins the bats to the center of the workspace.
The right hand has two tasks to perform:
To select a volume subset, the user presses right button 2 to place one corner of the volume to be displayed, drags the right bat to the opposite corner, then releases the button, automatically culling the glyphs outside of this box. As the selection box is being swept out, the front and back walls are drawn as translucent rectangles so that the user can see what glyphs are being selected. The user may restate the volume at any time by sweeping out a new subset box.
To select a single glyph, the user uses the right bat to orient a probe into the volume, and the glyph closest to the probe has its value printed and passed through a socket connection to the Telltale system. The corresponding document can then be displayed in Telltale. The document ID is also displayed in the 3D scene using screen-aligned text at the glyph, and at the corresponding 2D locations on each of the boundary walls of the volume. Thus, the box that encloses the entire 3D volume provides 3 orthographically projected 2D surfaces which can be used to present information. In addition to the document ID, the appropriate projected X and Y location of the glyph at each boundary wall is displayed, along with an axis-aligned line drawn towards the origin of the coordinate system. This helps to provide detailed spatial measurements as the need arises.
A probe, represented by a narrow cylindrical shaft, is attached to the right cursor, and the user controls the position and orientation of the probe with the right bat. The distance from this probe is computed for each control point using a specialized distance metric called the probe metric, and the grid point that generates the smallest value is highlighted.
Around the probe axis is drawn a translucent half-cone which has a radial spread angle of 10 degrees. Only the back face of the cone is drawn, so that it looks like a translucent scoop, which helps to disambiguate the scene. Objects that are behind the scoop are dimmed by the translucency, thereby highlighting the closer objects.
We have applied these visualization techniques and the two-dimensional IVEE system [1] to the output of the previously described Telltale system. Currently, the user may select document similarities from the Telltale system to be visualized using SFA, can specify documents of interest within SFA, and see the document text within Telltale through the use of socket connections. The document corpus utilized was 1833 articles from the Wall Street Journal from September 18, 1989 to October 13, 1989. Several document similarities to the following example ``thematic'' articles have been generated:
The volume visualization and interactive stereoscopic manipulation of this data set highlights the similarities of these topics significantly better than a 2D visualization, as can be seen by comparing Figures 3 and 4. The two relationships shown in Figure 4 are not immediately clear from examining Figure 3. In fact, even after detailed examination, the relationship within several articles of commodity (gold prices) and the foreign exchange rate does not become apparent because the similarity of the documents to commodity prices (displayed as color) is not as high as some of the other articles within the corpus.
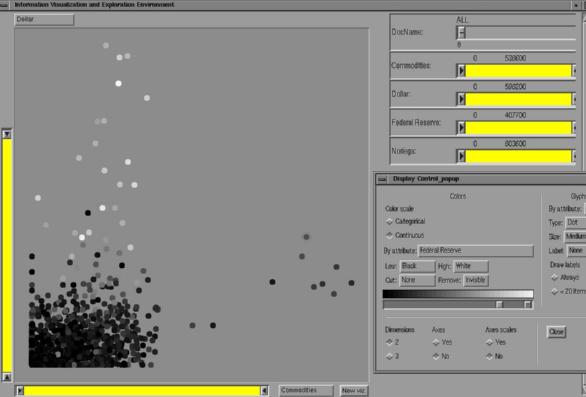
Figure 3: Two-dimensional visualization of 1833 documents'
relationship to commodity prices, foreign exchange, and the federal
reserve using the IVEE system.
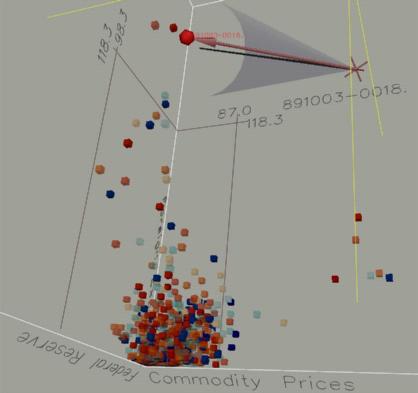
Figure 4: Three-dimensional visualization of 1833 documents'
relationship to commodity prices, foreign exchange, and the federal reserve.
The probe is selecting one article.
The visualization shown in Figure 5 shows the similarity to the stock market, foreign exchange rate, and Federal Reserve Bank, respectively mapped to the X, Y, and Z axes. Again, the date of the article is visualized as the color of the glyph. The transparency of the glyph was also controlled by the article date, with the most recent and oldest articles being opaque and the middle articles semi-transparent. Through interactive visualization of this data, it is clear that there are several articles that lie along the diagonal from the origin to the front, top, right corner of the data volume, indicating a strong relationship of these three themes in several documents in this corpus. In contrast, the visualization in Figure 6, does not clearly show the ternary relationship among these themes.
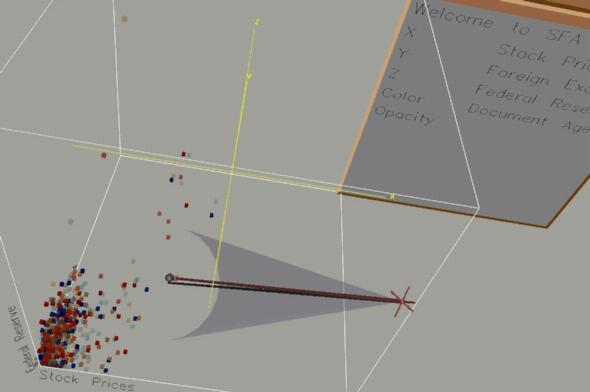
Figure 5: Three-dimensional visualization of 1833 documents'
relationship to stock prices, foreign exchange,and the federal reserve.
The legend panel is also visible.
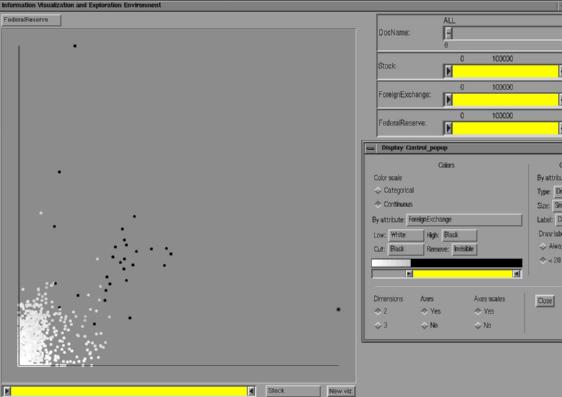
Figure 6: Two-dimensional visualization of 1833 documents' relationship to stock
prices, foreign exchange, and the federal reserve using the IVEE system.
The results displayed in these figures clearly show that volumetric glyph visualization is much better for visualizing and analyzing complex relationships among documents. For analysts who must manage large corpora and have many data sets to be analyzed each day, the benefit of our SFA system over traditional 2D visualization systems is very significant. Complex relationships can be analyzed more quickly through three-dimensional spatial analysis with the aid of two-handed interaction and stereoscopic viewing. Perceptually meaningful mappings of data to glyph color, size, transparency, and shape also significantly aid in the understanding of multi-dimensional data relationships.
These visualizations have shown that realtime two-handed interactive volume visualization of document corpora can quickly convey trends and multi-dimensional relationships among the information data. Careful attribute mapping and interactive volume culling can be used for quick elimination of useless data, allowing better analysis of the most interesting information. The two-handed interaction metaphor is a very natural way to interact with volumetric data, and a naive user can become comfortable and proficient using the system within 5 to 10 minutes. The current system permits interactive picking of document glyphs, allowing the retrieval of the document text in the Telltale system for further exploration. SFA provides great flexibility in information mapping for improved perception of relationships and also allows for the real-time interaction, navigation, manipulation, and increased understanding of time-varying multivariate information spaces.
We are currently working on several extensions to the system, including additional mappings of information attributes (dimensions) to glyph attributes, more flexible coupling between SFA and the Telltale system, and improved rendering techniques for glyph rendering. We are also exploring the characterization and suitability of two-dimensional and three-dimensional techniques for various information visualization tasks.
Interactive Volumetric Information Visualization for Document Corpus Management
This document was generated using the LaTeX2HTML translator Version 95 (Thu Jan 19 1995) Copyright © 1993, 1994, Nikos Drakos, Computer Based Learning Unit, University of Leeds.
The command line arguments were:
latex2html -split 0 gi97.tex.
The translation was initiated by Chris Shaw on Mon Apr 7 16:22:18 CST 1997