
 |
 |
 |
 |
 |
  |
 |
|||||||||||||
 |
|||||||||||||
Housing Susceptibility |
|||||||||||||
Being near the San Andreas fault line, Metro Vancouver has been identified as an earthquake hazard area, according to Natural Resources Canada. The map below shows the relative hazard, or damage susceptibility of single family dwellings across Canada from earthquakes according to seismic activity. As shown, Metro Vancouver is located in a high relative seismic hazard zone. |
|||||||||||||
 |
|||||||||||||
Older housing in Metro Vancouver is less likely to be earthquake resistant, making those municipalities and cities with a majority of housing built before 1986 more susceptible to severe earthquake damage. Based on statistics from Statistics Canada, the following municipalities and cities within Metro Vancouver have been ranked by percentage of houses constructed before 1986. The higher the percentage of older housing, the higher the rank - with 1 being the most at risk of severe earthquake damage to 21 being the lowest risk. |
|||||||||||||
 |
|||||||||||||
Housing Earthquake Risk |
|||||||||||||
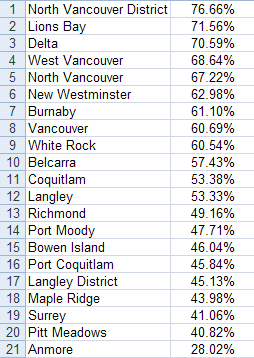 |
|||||||||||||
 |
|||||||||||||
| Please note that the 2001 Canada Census boundaries differ from data in previous years, however the data presented for housing is from Statistics Canada and it is assumed that proper adjustments have been made to the data. | |||||||||||||
| For more information on how to reduce earthquake damage on housing, click here. | |||||||||||||
| Back to Top | |||||||||||||