
|
|
|
|
|
|
|
|
|
|
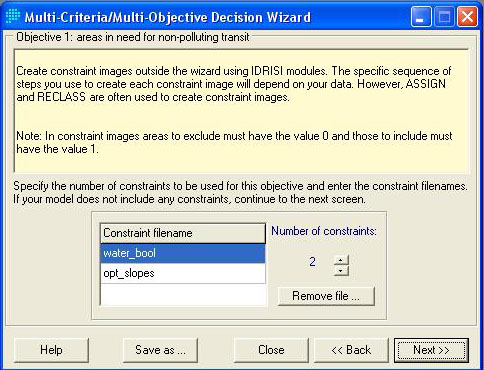
Step 1: Contraints are defined. Boolean images of water_bool and opt_slopes from previous macro model are being used.
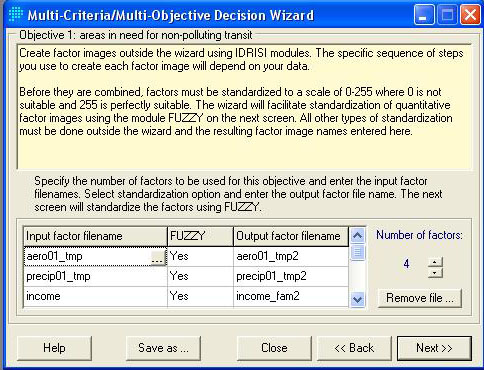
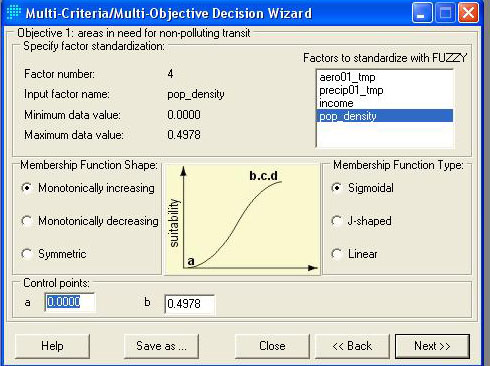
Step 2: Defining factors. These factors are variables that are allowed a fuzzy tolerance and weighting. In this case, the factors included are the 2001 aerosol and precipitation distribution raster layers, raster layer for average family income, and raster layer for population density.
Step 3: Aerosol is given a higher suitability as its concentration increases because there's an increasing pollution (need of non-polluting public transit) trend as it rises in value.
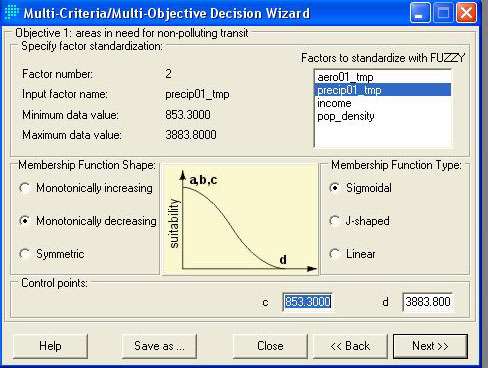
Step 4: Precipitation is given a higher suitability as its concentration decreases because there's an increase chance of smog production when precipitation is lower.
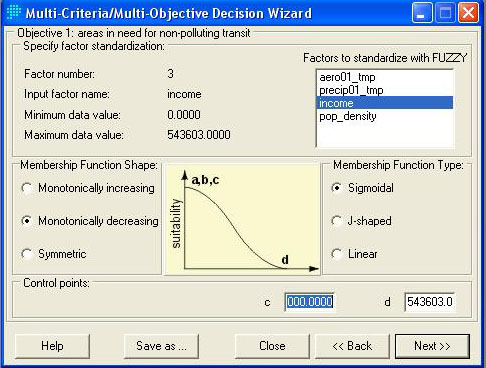
Step 5: Income is given a lower suitability as it increases because generally, the wealthier the people get, the less they ride on public transit.
Step 6: Population is given a higher suitability as it increases because a higher population naturally provides a higher demand for transit. Also, a higher population area also translates to more urban aerosol pollution.
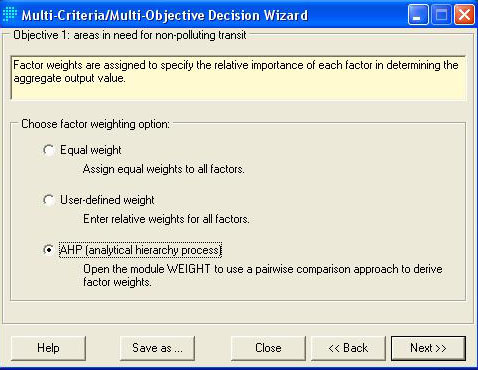
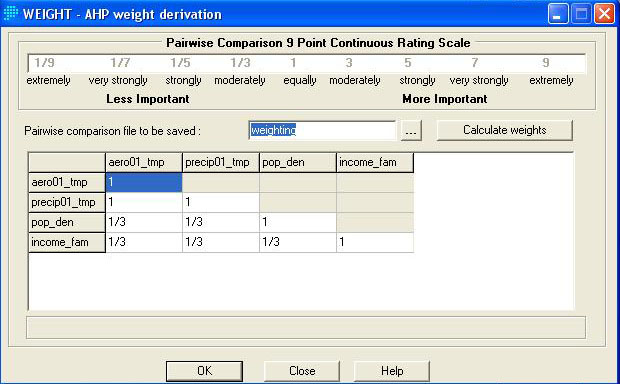
Step 7 & 8: AHP weighting is used to define the relative importance of each factor. As one can see, precipitation and aerosol are given a equal importance because aerosol creates the air pollution, while the precipitation is the counter-factor that washes the pollution away. Both income and population density is less important than aerosol and pollution. Also, population is of a higher importance than income.
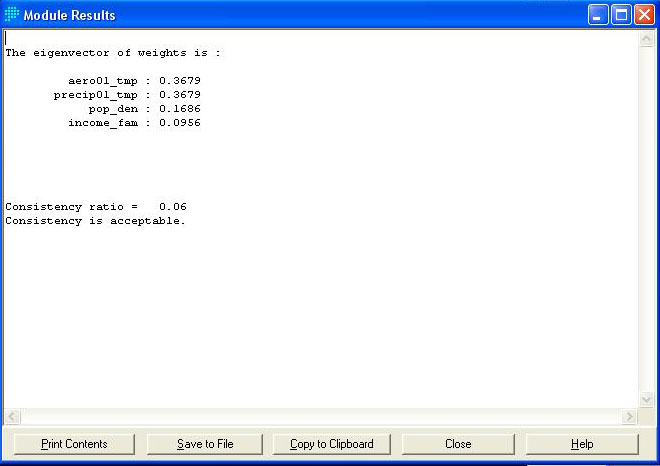
Step 9 & 10: The output of weights and eigenvector. The eigenvector is the consistency ratio. In this case, it is below 0.10, thus it is a suitable ratio. After the weights are inputted in step 10, there are a few more minor steps that followed that the user can press "Next" all the way to finish the MCE suitability analysis.