Data Collection and Manipulation
Precipitation and Aerosol Data
Two main types of data required by this study are precipitation
and aerosol data archives. For precipitation, the data is obtained directly
from the Environment Canada website (http://www.climate.weatheroffice.ec.gc.ca/).
There are over 50 stations in the GVRD that provide precipitation data archives.
Their data include hourly, daily, and monthly temperature, snow precipitation,
rain precipitation, total precipitation, etc. For the purposes of this study,
monthly total precipitation is selected because it represents both rain and
snow. If aerosol has an effect on clouds in general, there will be either an
increase or a decrease in the total precipitation pattern whether it is rain
or snow. Thus, total precipitation is the data category of choice. After this,
the time scale of the database of use has to be determined. For this, monthly
precipitation data is collected. This is of one main reason; monthly precipitation
data can be summed up as yearly totals easily. All stations with missing data
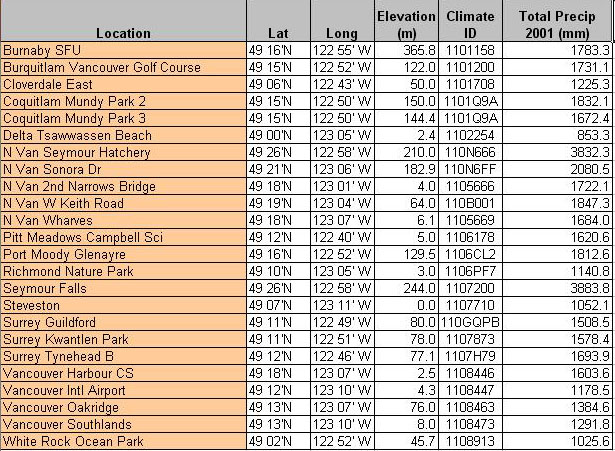
are omitted from the database. In the end, data from 22 stations over the GVRD
is included for total precipitation data (Table 1).
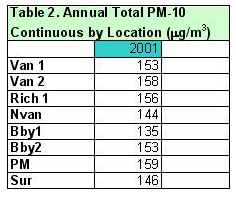
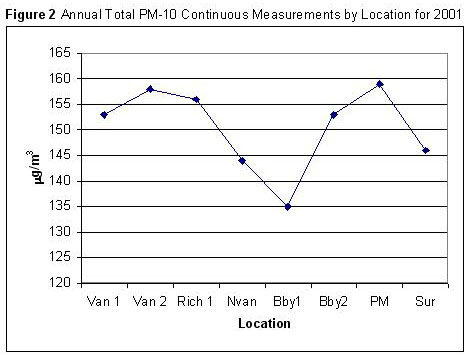
For aerosols (Table/Figure 2), data is downloaded from Environment
Canada’s National Air Pollution Surveillance Network (NAPS, http://www.etc-cte.ec.gc.ca/NapsStations/Default.aspx).
Sixteen stations with aerosol archives are listed for the GVRD. However, only
eight of these stations have suitable and compatible data for this analysis.
There are many different choices of the type of aerosol data for these stations.
For example, they contain data for NOx, SOx, Ozone, PM2.5, PM10, etc. Some stations
have more categories and some others have fewer. This study has narrowed down
to the data for PM10, which are particulate matter of ten or less micrometers.
The reason for choosing PM10 is simple; it contains the majority of aerosols
in the atmosphere that can act as condensation nuclei for water vapour to collect.
Next, there is a choice between annual means and monthly data. It is determined
that the annual means for PM10 aerosol concentration are too similar from one
station to another, with differences ranging no more than 1-2mg/m3.
Hence, annual means are basically useless to find differences across the region.
Consequently, obtaining annual totals calculated from monthly sums on the database
is the most reasonable choice. Please refer to Table 2 and 3 in the appendix
for the precipitation and aerosol data being used for the analysis.
Table 1 Precipitation Data of the GVRD
|
|
|
|
Social Geographic Data
In comparison to the precipitation and aerosol data, the
population and income data of the GVRD is obtained faily easiy from the Canada
Census (2001) database in the SIS Lab. Average Family Income data can be directly
transferred to DAs within the GVRD area. Population density data has to be
manipulated from the orginal data set. The manipulation involves using the
population within a DA divided by the area of the DA (in sq.meters). This
is all done in the attribute table of ArcMap.
Data Transfer Issues
Within this analysis, there are many cross-software use between
ArcMap 9 and IDRISI. Most of the time, vector shapefiles from ArcMap has to
be transfered to IDRISI's raster format for overlaying and MCE use. This vector
to raster conversion is done using the macro-model in IDRISI (assuming that
the file is already transferred from ArcMap with the correct processes). The
below are two examples of vector to raster conversion using the INITIAL and
POLYRAS modules. The green box represent a vector layer, while the purple
box represent a raster layer. The pink parallelograms represents modules.
In the bottom case, a yellow attribute value box is used to ASSIGN appropriate
values to the raster layers.
| 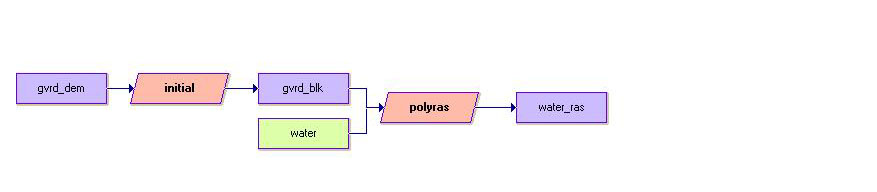
Example 1. Converting the water vector
layer into raster using the gvrd_dem image as a source for the raster
basemap.
|

Example 2. Conversion to output income
and population density values. Notice the module CONVERT is used to
convert real population density values into integers. Also, the module
ASSIGN is used for assigning income and population values into their
respective raster layers.
|
Next Page (Analysis)