SPATIAL ANALYSIS
After working with the constraints and factors, all these layers were incorporated together to produc potential Skytrain station locations. For this purpose, MCE with the Weighted Linear Combination (WLC) method was used based on the constraints and factors. The weighting of the factors was performed as a part of WLC method and the pairwise comparison matrix's are shown in the tables below.
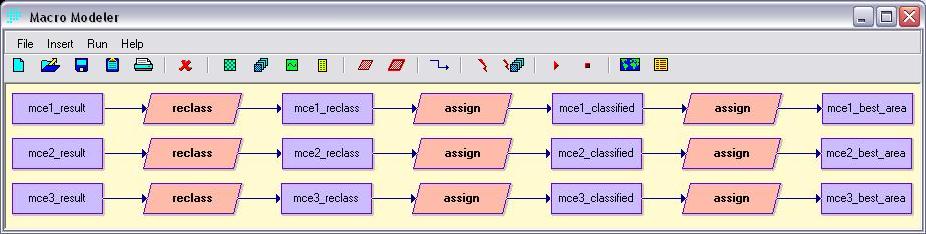
MCE 1 | MCE 2 | MCE 3 | Cartographic Model of Reclassifying the MCE results | Final result
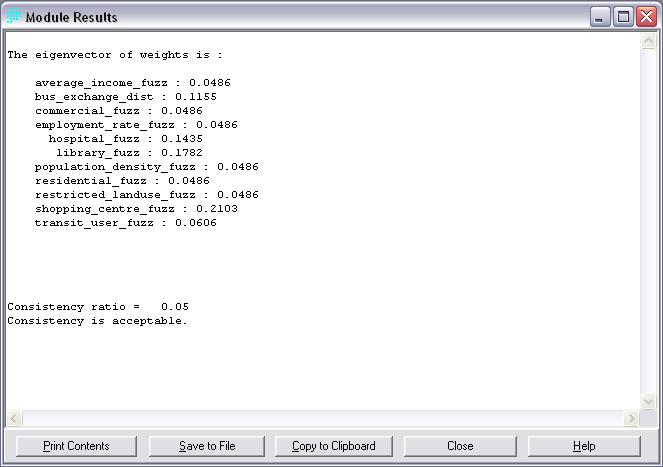
Criteria of bus exchange, hospital, library, and shopping centre were weighted more heavily compared to others for high accessiblity to public service.
| average_ income_ fuzz |
bus_ |
commercial _fuzz |
employment _rate_fuzz |
hospital _fuzz |
library _fuzz |
population _density _fuzz |
residential _fuzz |
restricted _landuse _fuzz |
shopping _centre _fuzz |
transit _user _fuzz |
|
| average_income_fuzz | 1 | --- | --- | --- | --- | --- | --- | --- | --- | --- | --- |
| bus_exchange_fuzz | 3 | 1 | --- | --- | --- | --- | --- | --- | --- | --- | --- |
| commercial_fuzz | 1 | 1/3 | 1 | --- | --- | --- | --- | --- | --- | --- | --- |
| employment_rate_fuzz | 1 | 1/3 | 1 | 1 | --- | --- | --- | --- | --- | --- | --- |
| hospital_fuzz | 3 | 3 | 3 | 3 | 1 | --- | --- | --- | --- | --- | --- |
| library_fuzz | 3 | 3 | 3 | 3 | 3 | 1 | --- | --- | --- | --- | --- |
| population_density_fuzz | 1 | 1/3 | 1 | 1 | 1 | 1/3 | 1 |
--- | --- | --- | --- |
| residential_fuzz | 1 | 1/3 | 1 | 1 | 1/3 | 1/3 | 1 | 1 | --- | --- | --- |
| restricted_landuse_fuzz | 1 | 1/3 | 1 | 1 | 1/3 | 1/3 | 1 | 1 | 1 | --- | --- |
| shopping_centre_fuzz | 3 | 3 | 3 | 3 | 3 | 3 | 3 | 3 | 3 | 1 | --- |
| transit_user_fuzz | 1 | 1/3 | 1 | 1 | 1/3 | 1/3 | 1 | 1 | 1 | 1 | 1 |
The module results derived from calculating the factors weights from the above matrix are shown below.
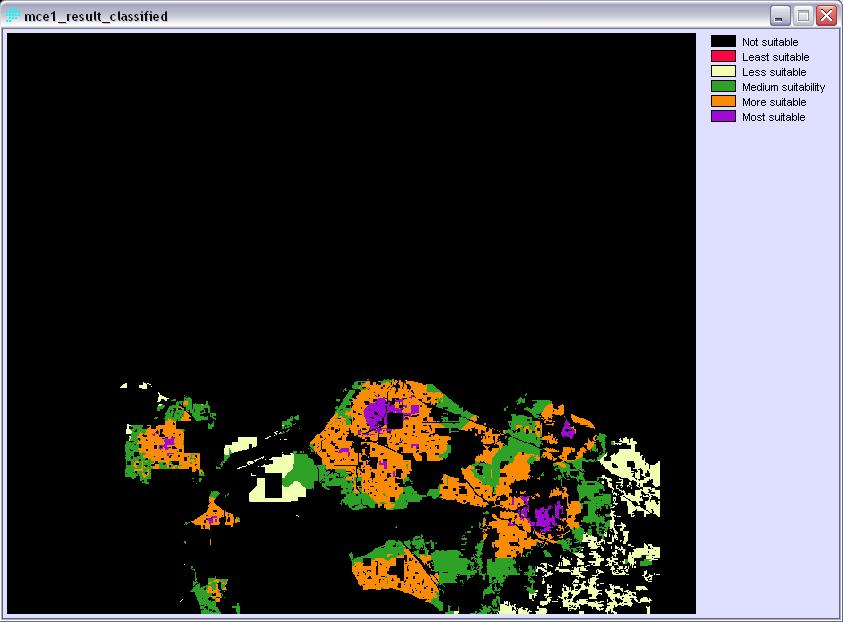
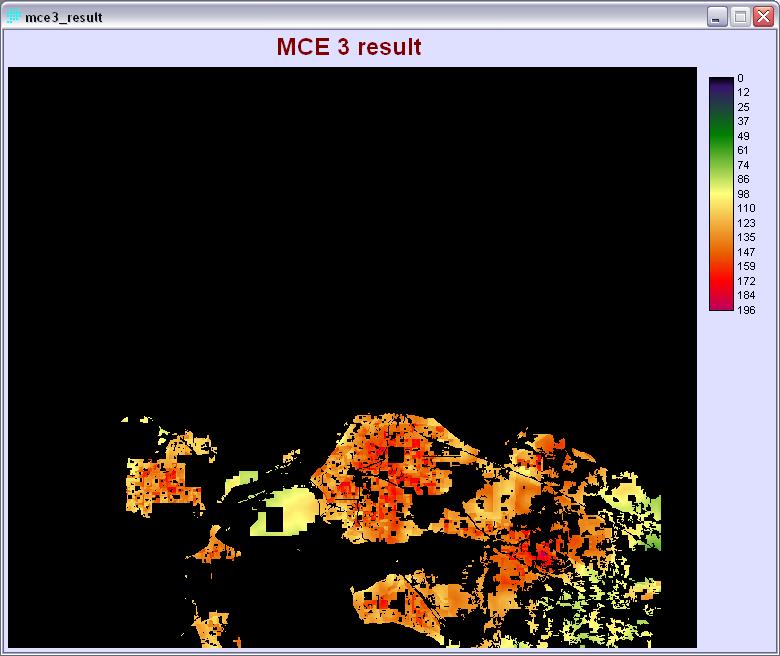
Below is the result image from the WLC method:
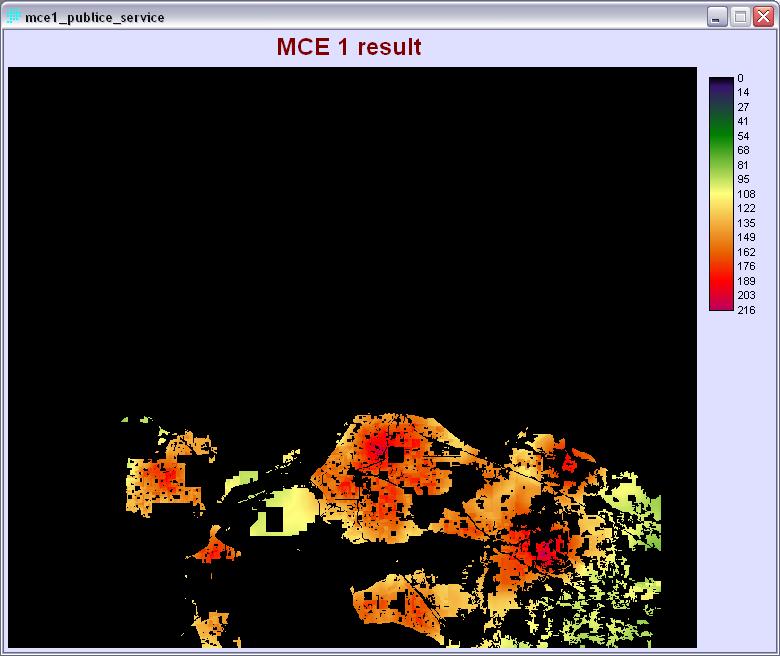
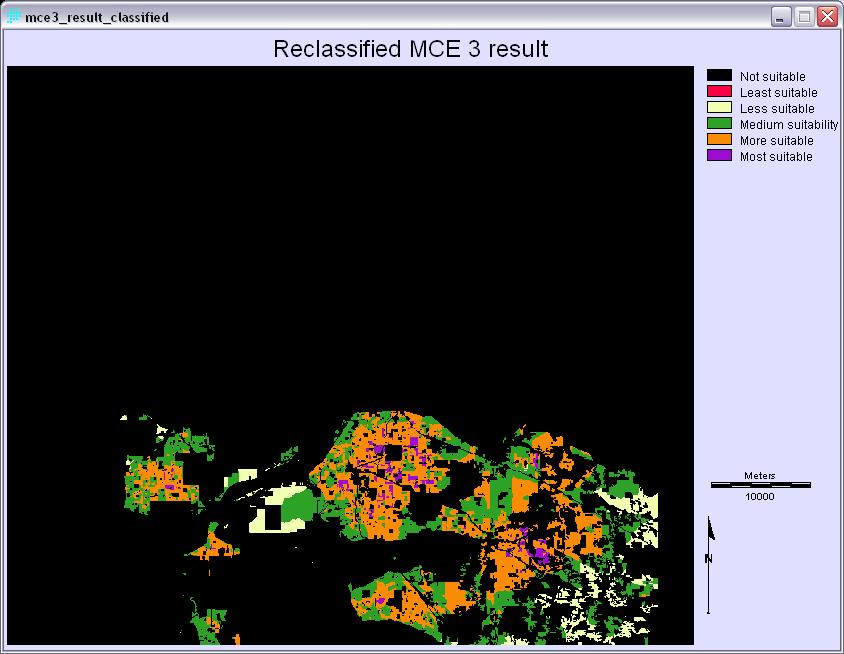
The result layer was then reclassified into five categories based on their suitability values. The suitability range was divided with equal interval.
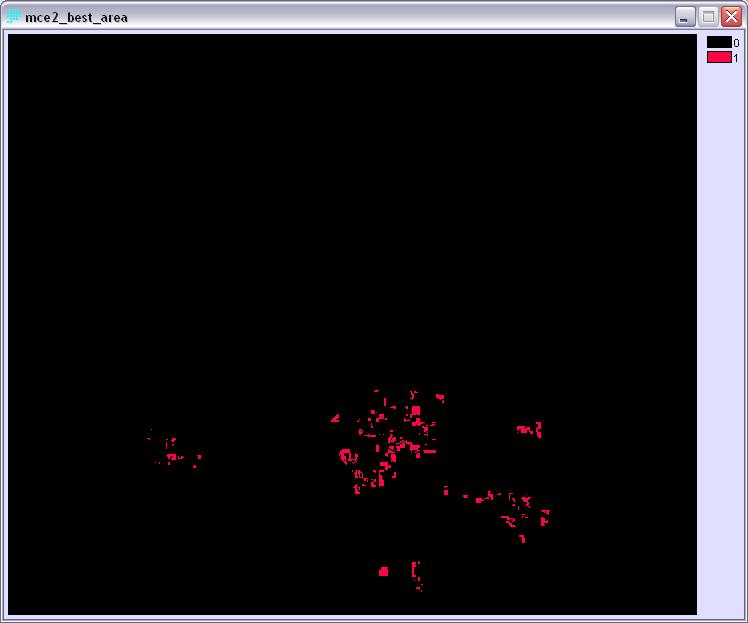
ASSIGN module was used for the raster image of best area. Area with value of five now has value of one and the rest of the area was assigned to 0.

Criteria of average income, population density, employment rate, and transit users were weighted more heavily compared to others for high ridership to support regular transit service.
| average_ income_ fuzz |
bus_ |
commercial _fuzz |
employment _rate_fuzz |
hospital _fuzz |
library _fuzz |
population _density _fuzz |
residential _fuzz |
restricted _landuse _fuzz |
shopping _centre _fuzz |
transit _user _fuzz |
|
| average_income_fuzz | 1 | --- | --- | --- | --- | --- | --- | --- | --- | --- | --- |
| bus_exchange_fuzz | 1/3 | 1 | --- | --- | --- | --- | --- | --- | --- | --- | --- |
| commercial_fuzz | 1/3 | 1 | 1 | --- | --- | --- | --- | --- | --- | --- | --- |
| employment_rate_fuzz | 1 | 3 | 3 | 1 | --- | --- | --- | --- | --- | --- | --- |
| hospital_fuzz | 1/3 | 1 | 1 | 1/3 | 1 | --- | --- | --- | --- | --- | --- |
| library_fuzz | 1/3 | 1 | 1 | 1/3 | 1 | 1 | --- | --- | --- | --- | --- |
| population_density_fuzz | 1 | 3 | 3 | 1 | 3 | 3 | 1 |
--- | --- | --- | --- |
| residential_fuzz | 1/3 | 1 | 1 | 1/3 | 1 | 1 | 1/3 | 1 | --- | --- | --- |
| restricted_landuse_fuzz | 1/3 | 1 | 1 | 1/3 | 1 | 1 | 1/3 | 1 | 1 | --- | --- |
| shopping_centre_fuzz | 1/3 | 1 | 1 | 1/3 | 1 | 1 | 1/3 | 1 | 1 | 1 | --- |
| transit_user_fuzz | 1 | 3 | 3 | 1 | 3 | 3 | 1 | 3 | 3 | 3 | 1 |
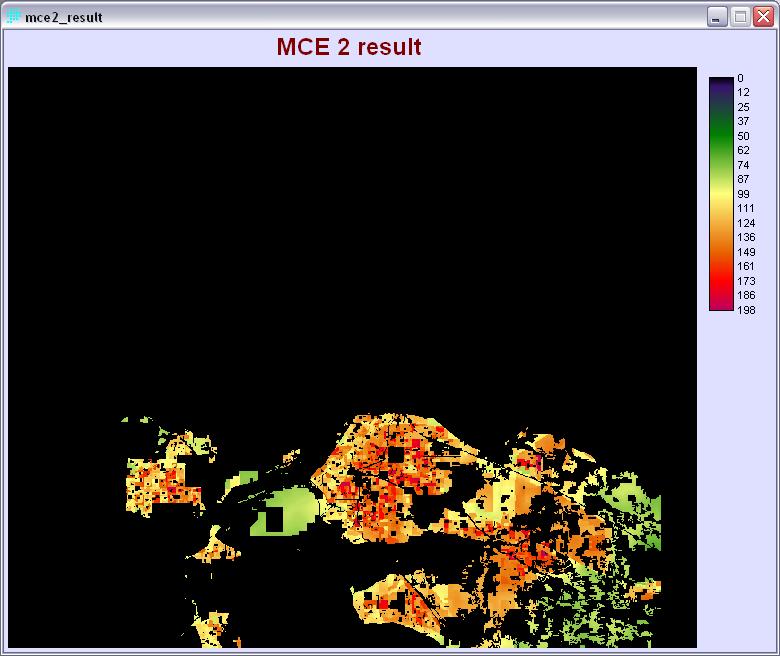
The module results derived from calculating the factors weights from the above matrix are shown below.

Below is the result image from the WLC method:
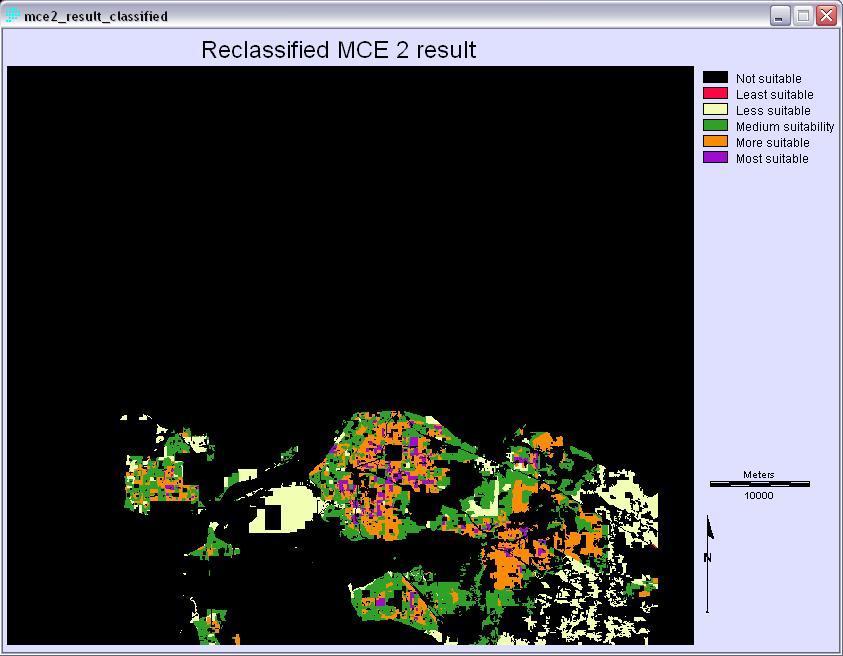
The result layer was then reclassified into five categories based on their suitability values. The suitability range was divided with equal interval.
The Boolean image of the most suitable area resulted from MCE 2:
All the criteria are weighted equally since the weightings for MCE 1 and MCE 2 are personal assumptions.

The result image:
Reclassified MCE 3 result:
The Boolean image of the most suitable area resulted from MCE 3:
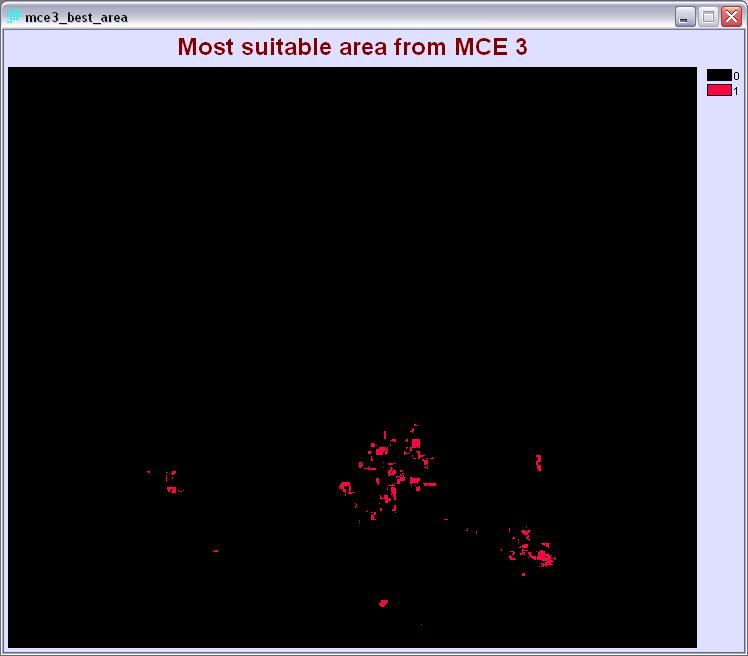
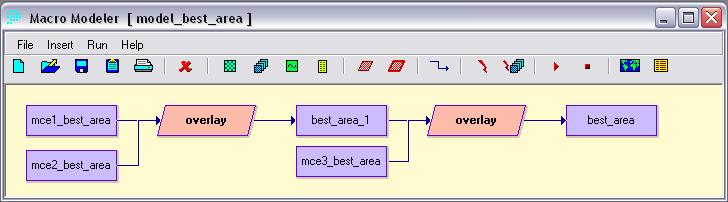
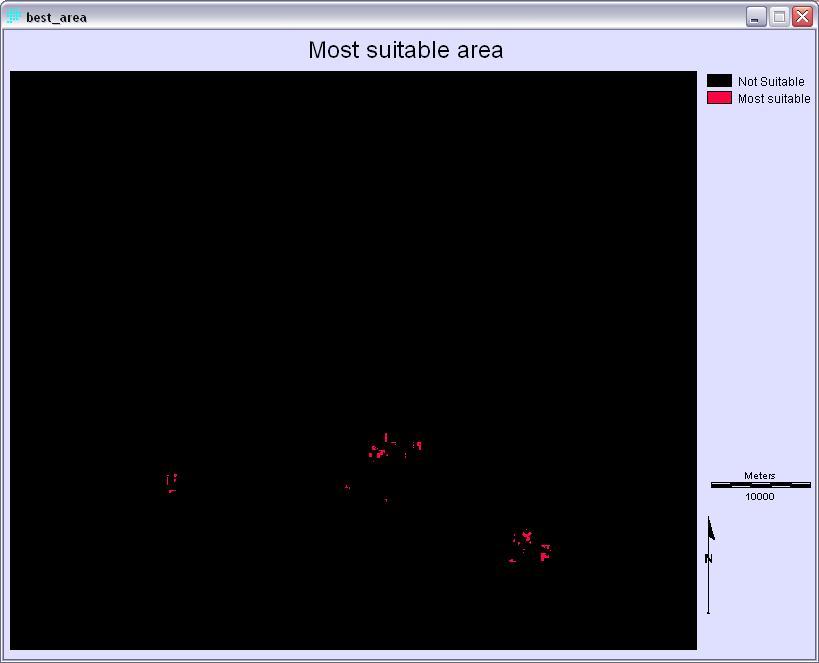
To determine the prospective location, all three MCE's were utilized to create Boolean maps for all three reclassified MCE’s. A new value of “1” is assigned to the current value of “5” (most suitable area), and the rest of area is assigned to “0.” This was done in the above steps. Finally, series of OVERLAY modules were executed to combine the most suitable area of MCE 1, MCE 2, and MCE 3 to get the best of the best area. The final result is called best_area.rst: