METHODOLOGY
A number of constraints and factors were identified in order to carry out the Multi-Criteria evaluation (MCE) analysis. The constraints layers were used as Boolean images to limit the analysis to a particular geographic region. Factors are used to define the level of suitability using fuzzy module and they were all based on distance from the given features.
Constraints | Factors | Cartographic Model for the Methodology | Summary of the input Factor files which are used in the FUZZY model
1) Landuse
Sites must be outside of the following landuse types
• Lakes and waterbodies
• Recreation and protected natural aras
• Transportation, communication, and utilities
• Industrial areas
• Agricultural areas
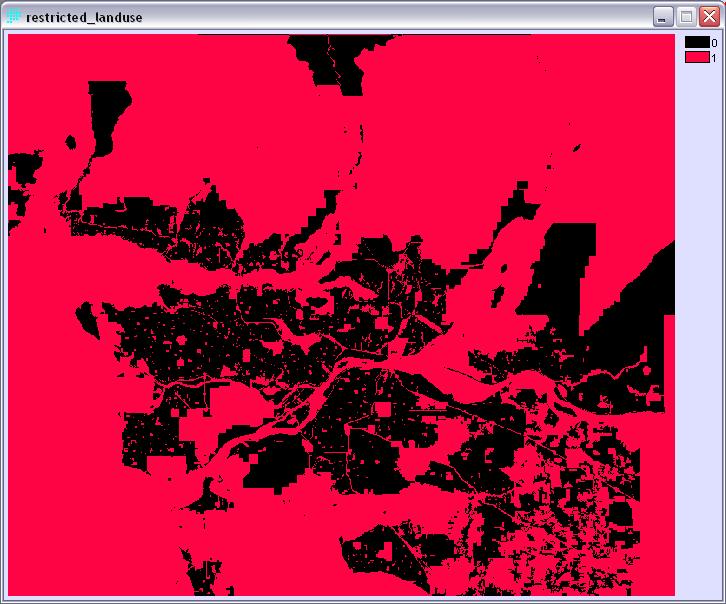
The ASSIGN module was used to create a restricted landuse raster image based on Landuse ID’s
| Landuse Type | Landuse ID | Assigned Value |
| Agricultural | 14 | 1 |
| Recreation and protected natural areas | 3 | 1 |
| Lakes and water bodies | 1 | 1 |
| Transportation, communication and utilities | 0 | 1 |
| Protected watershed | 4 | 1 |
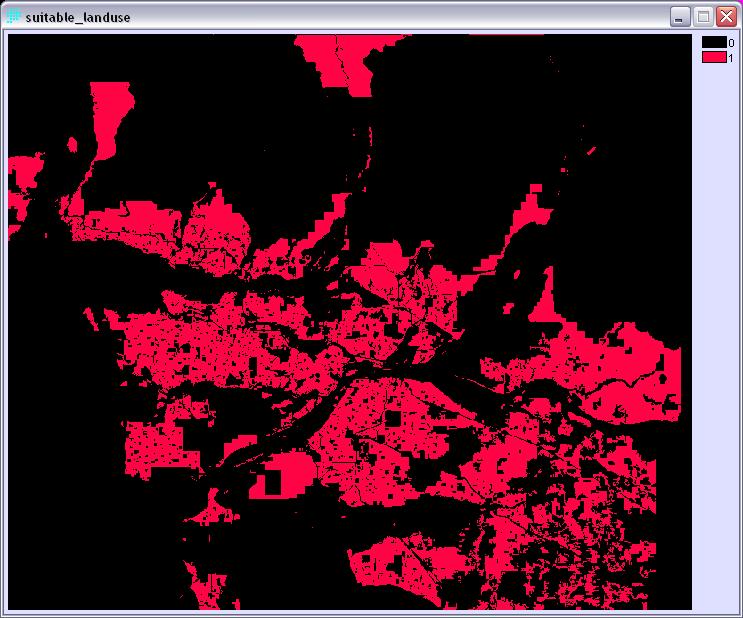
To get a suitable landuse raster image, ASSIGNE module was used again. Cells with value of zero were assigned to value of one and cells with value of one were assigned to value of zero.
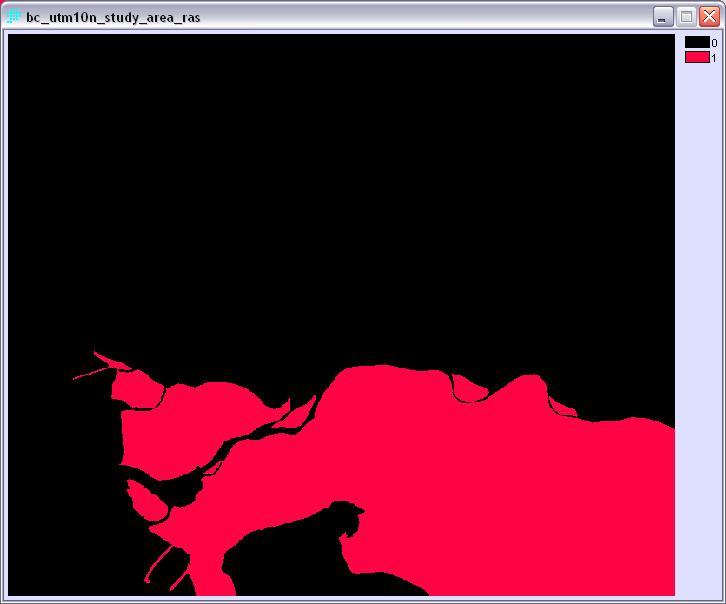
2) Study Area
Sites must be within the cities of Richmond and South of Fraser region (which includes Delta, Ladner, White Rock, Surrey, City of Langley, and Township of Langley.
A Boolean image was created from GVRD_muni.rst using the ASSIGN module based
on municipality ID’s
| Municipality | Municipality ID | Assigned Value |
| Richmond | 8 | 1 |
| Ladner | 28 | 1 |
| Delta | 7 | 1 |
| White Rock | 6 | 1 |
| Surrey | 5 | 1 |
| City of Langley | 4 | 1 |
| Township of Langley | 3 | 1 |
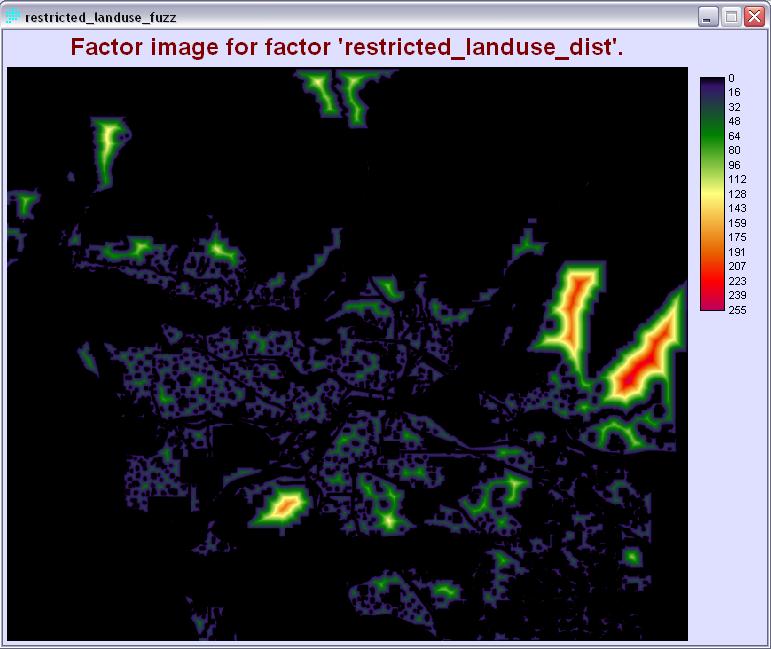
1) Distance from landuse types
Sites should be away from the inappropriate landuse types. The farther away the better. The landuse constraint layer was used to create the distance layer
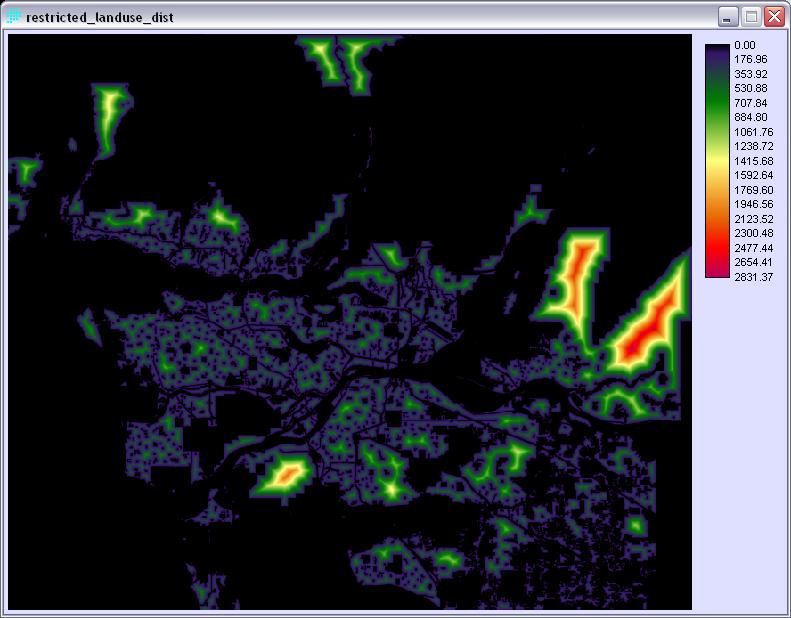
This layer was then used to create landuse_fuzz.rst using the fuzzy module. A monotomically increasing linear function was used for the result. Since the site should be 100m away from these landuse types, 100m was assigned as the control point a). The maximum value of the distance layerwas assigned to the Control point b), which is 2832.
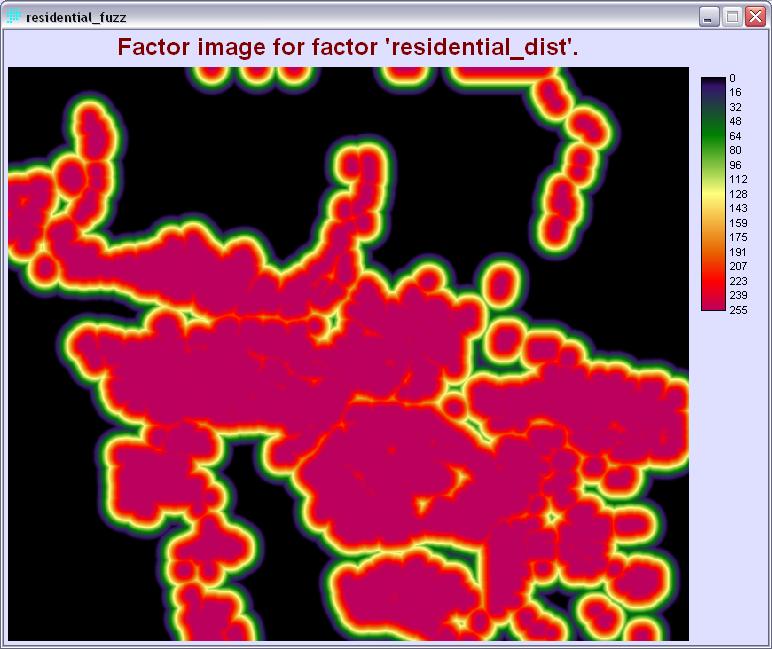
2) Distance from residential areas
For resident's convenience, they like adjacency to train stations (2km is optimal), but they don't like any train station within 500m for the noise issue.
A distance layer of residential area was created using DISTANCE module

This distance image was then used to create factor image residential_fuzz.rst using the FUZZY module. A monotomically decreasing sigmoidal function was used for the result. Control point c) was 50m and d) was 3km.
3) Distance from commercial areas
Sites should be around 2km away from current commercial areas.
A distance layer of commercial area was created using DISTANCE module
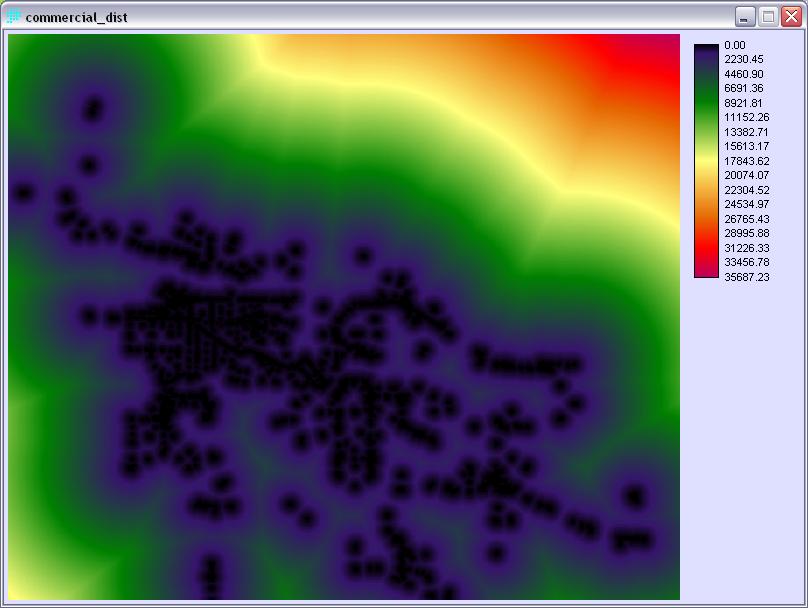
This layer was then used to create commercial_fuzz.rst using the FUZZY module. A symmetric sigmoidal function was used for the result. Control point a) was 0, control b) and c) were 2000, and control point d was 35688, the maximum value from commercial_dist.rst
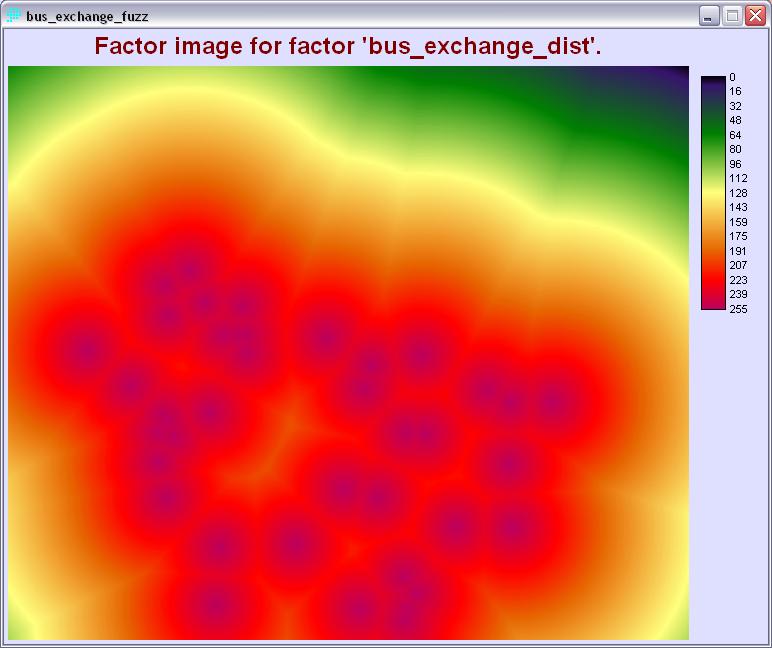
3) Distance from existing bus exchanges
Sites should be close proximity to the existing bus exchanges for high accessibility to the new skytrain stations. A distance layer for bus exchanges was created using DISTANCE module

This layer was then used to create bus_exchanges_fuzz.rst using the fuzzy module. A monotomically decreasing linear function was used for the result. Control point a) was 0m and b) was 36803, the maximum distance value from the distance layer.
4) Distance from existing shopping centres
Sites should be in close proximity to the existing libraries, hospitals, and shopping centre. This a crucial factor in the analysis because the point of expanding transit service is to provide high accessibility to public service networks.
A distance layer for existing shopping centre was created using DISTANCE module from the converted raster image.

This layer was then used to create shopping_centre_fuzz.rst using the fuzzy module. A monotomically decreasing sigmoidal function was used for the result. Control point c) was 0m and d) was 52682, the maximum value from shopping_centre_dist.rst distance image.

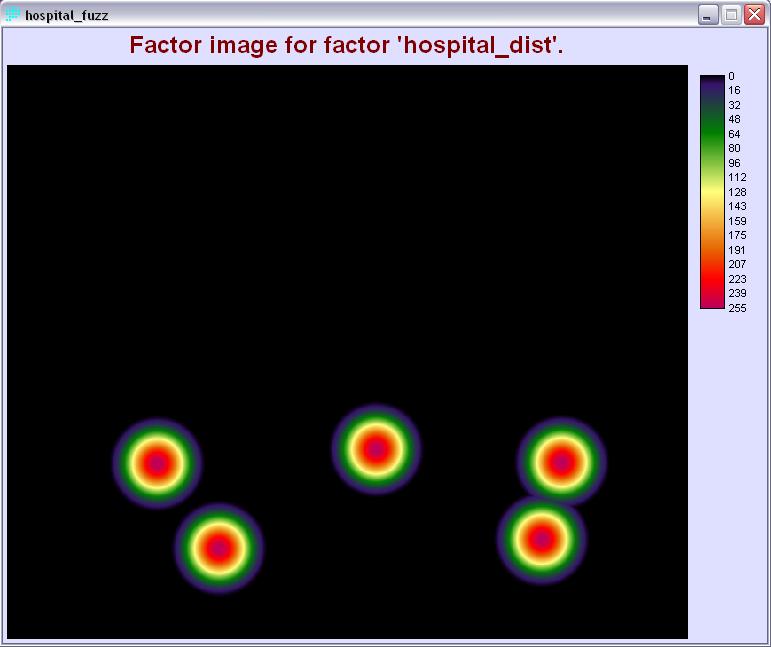
5) Distance from existing hospitals
Sites should be in close proximity to the existing hospitals. The closer the better.
A distance layer for existing hospital was created using DISTANCE module from the converted raster image.
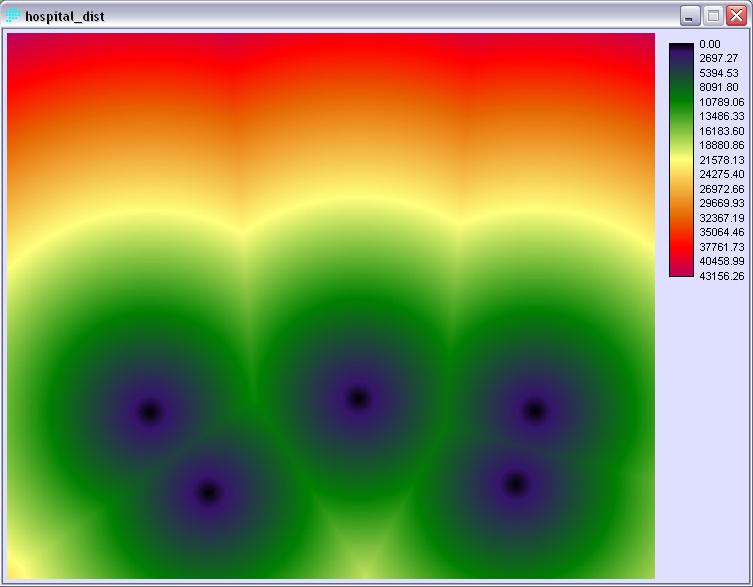
This layer was then used to create hospital_fuzz.rst using the fuzzy module. A monotomically decreasing linear function was used for the result. Control point a) was 0m and b) was 5000m.
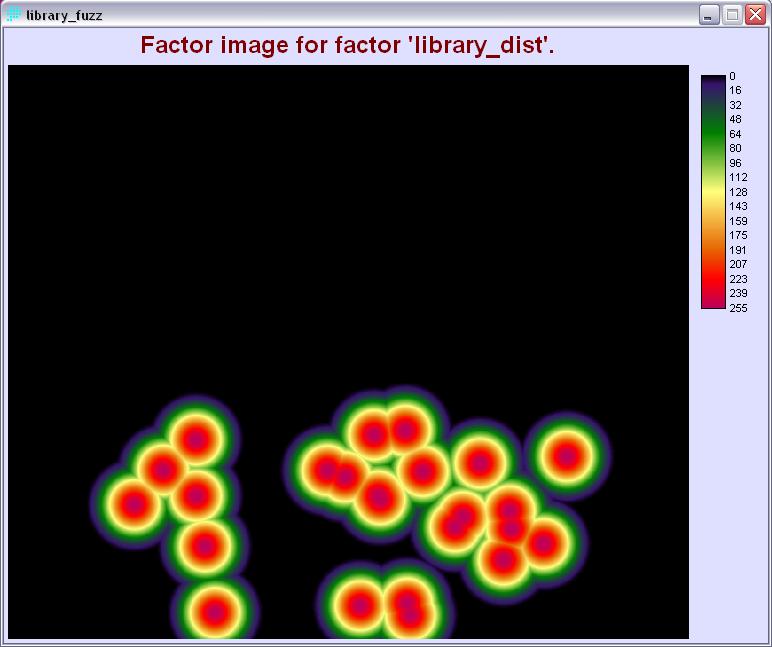
6) Distance from existing libraries
Sites should be in close proximity to the existing libraries. A distance layer for libraries was created using DISTANCE module.
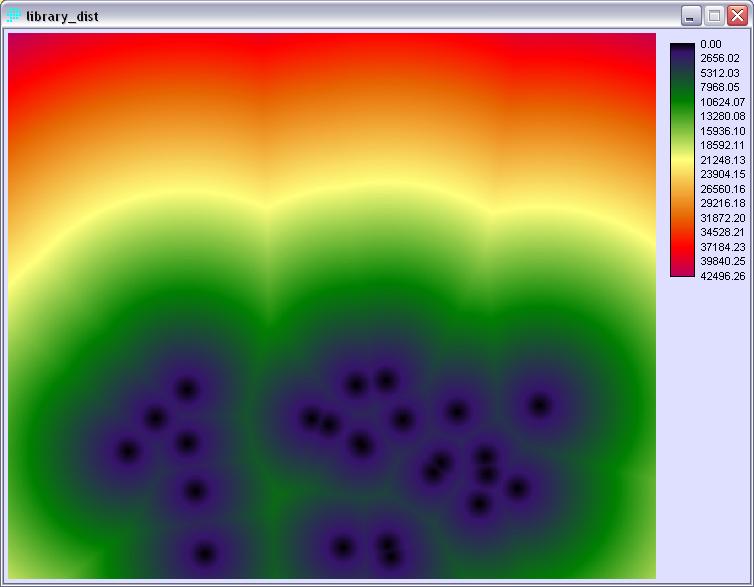
This layer was then used to create libraries_fuzz.rst using the fuzzy module. A monotomically decreasing linear function was used for the result. Control point a) was 0m and b) was 5000m.
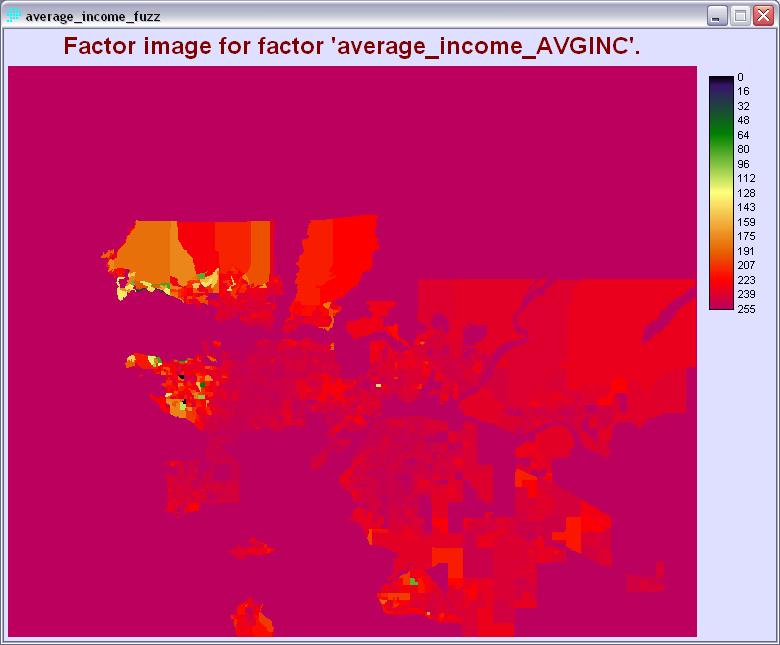
7) Average Income
Sites should be in close proximity to areas with a relatively low average family income since people with lower socioeconomic status are more likely to have high demand on the transit system
FUZZY module was applied to the raster layer of average income. Since the lower socioeconomic status displays the higher demand for public transit service, a decreasing linear function was used. Control point a) and b) was assigned to 3000 and maximum values obtained from the income raster layer, respectively. Since zero income will create free ridership problem, it does not provide the highest suitability. According to Marketing Charts, 12-14-year-old-age-group have an average annual income of $4,167 and 15-17-year-old-age-group have an average annual income of $4,023. Average income of $3000 is the around average between the two so a value of 3000 was assigned to control point c). The maximum value from the average income raster image, 187691, was assigned to control point d)
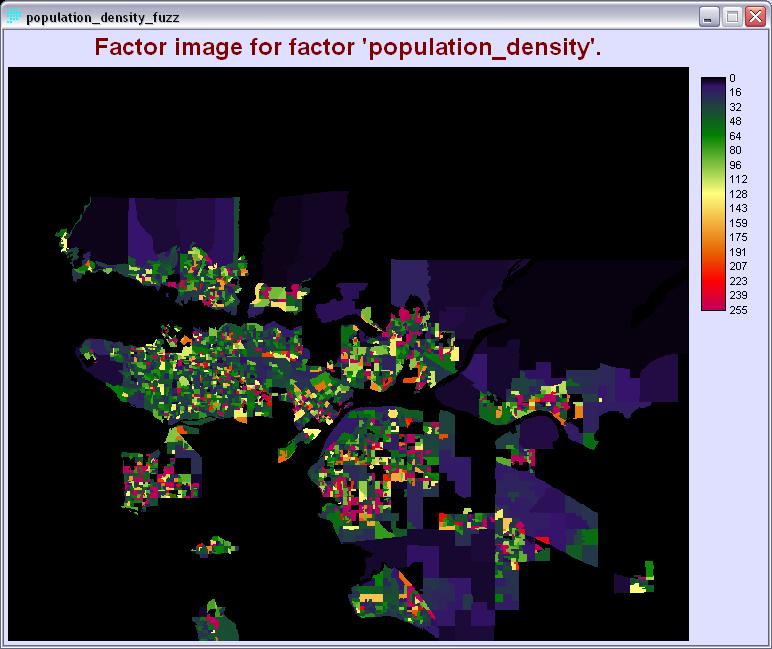
8) Population Density
Sites should be in close proximately to areas with a relatively high population density in order to utilize the skytrain use by more people
FUZZY module was applied to the raster layer of population density. Since the higher population density displays the higher demand for public transit service, an increasing linear function was used. Control point a) and b) was assigned to the minimum (0) and maximum (20) values obtained from the population density raster layer, respectively.
9) Transit Users
Sites should be in close proximately to areas with a relatively high number of people using public transit in order to utilize the skytrain use by more people.
FUZZY module was applied to the raster layer of non-drivers. Since the higher number of transit users displays the higher demand for public transit service, an increasing linear function was used. Control point a) and b) was assigned to the minimum (0) and maximum (985) values obtained from the population density raster layer, respectively.
![]()
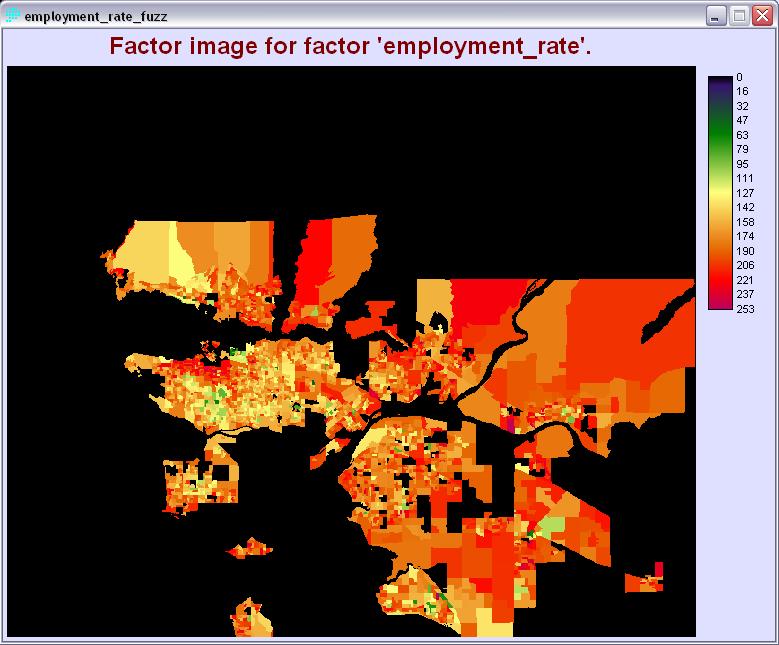
10) Employment Rate
Sites should be in close proximately to areas with a relatively employment rate to utilize the skytrain use by more people.
FUZZY module was applied to the raster layer of employment rate. Since the employment rate displays the higher demand for public transit service, a monotonically increasing linear function was used. Control point a) and b) was assigned to the minimum (0) and maximum (90) values obtained from the employment rate raster layer, respectively.

Note: The processes of conversion from one format to another are not shown in the cartographic model because they were done outside of the Macro Modeler
| Factor | Membership function shape | Control points |
| restricted_landuse_fuzz | Monotonically increasing | a) 100 |
| residential_fuzz | Monotonically decreasing | c) 50 d) 3000 |
| commercial_fuzz | Symmetric | a) 0 b) 2000 c) 2000 d) 35867 |
| bus_exchange_fuzz | Monotonically decreasing | c) 0 d) 36803 |
| shopping_centre_fuzz | Monotoincally decreasing | c) 0 d) 5000 |
| hospital_fuzz | Monotonically decreasing | c) 0 d) 5000 |
| library_fuzz | Monotonically decreasing | c) 0 d) 5000 |
| average_income_fuzz | Monotonically decreasing | c) 3000 d) 187691 |
| population_density_fuzz | Monotonically increasing | a) 0 b) 20 |
| employment_rate_fuzz | Monotonically increasing | a) 0 b) 90 |
| transit_user_fuzz | Monotonically increasing | a) 0 b) 985 |