Chapter Contents
Previous
Next
|
Chapter Contents |
Previous |
Next |
| Table Analysis |
The most basic table is a 2 × 2 table. Usually, the columns represent some sort of outcome, often yes or no, and the rows represent levels of a factor that may influence the outcome. Suppose, for example, that researchers were investigating the properties of a new "ouchless" bandaid for children. Interest lies in whether those children trying the test bandaid recorded fewer complaints on removal than those children using a regular bandaid. You can address this question by forming the two-way table of bandaid type and complaint status and then assessing the association between the rows and columns of that table.
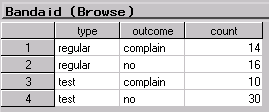
Figure 9.2 displays the data table containing these data. Note that the data are in frequency form, with the variable count containing the frequencies of the profile contained in each row of the table. The variable type is the type of bandaid tested and the variable outcome is the status of complaints.
|
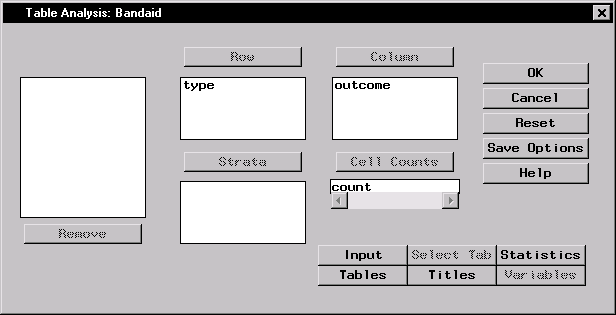
Figure 9.3 displays the resulting dialog.
|
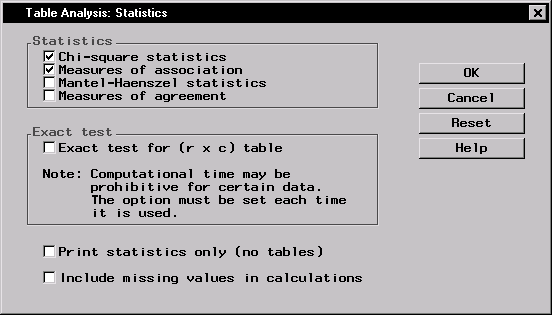
Figure 9.4 displays the Statistics dialog.
|
Finally, in order to customize the form of the displayed table, follow these steps:
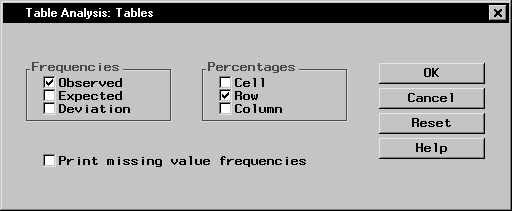
Figure 9.5 displays the resulting Tables dialog.
|
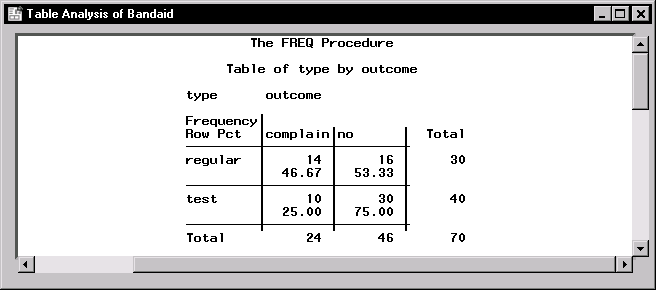
This requests that only the raw frequencies and the row percentages be listed in the printed table cell.
Click OK in the Table Analysis dialog to perform the analysis.
|
Figure 9.7 contains the table of computed chi-square statistics
for this table. The Pearson chi-square statistic, labeled
"Chi-Square," has a value of 3.57 and an associated p-value
of 0.0588 with 1 degree of freedom.
If you were doing strict hypothesis testing, you would not
reject the hypothesis of no association at the ![]() level
of significance. However, researchers in this case found enough
evidence in this pilot study to continue looking into the new product.
level
of significance. However, researchers in this case found enough
evidence in this pilot study to continue looking into the new product.

|
Several other chi-square statistics also appear in this output, such as the likelihood ratio chi-square and the Mantel-Haenszel chi-square. These statistics are asymptotically equivalent.
|
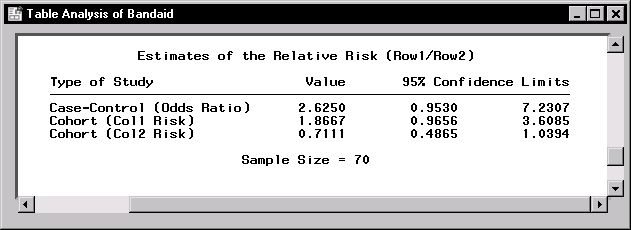
Figure 9.8 contains the table of relative risk estimates including the odds ratio, which is labeled "Case-Control." The odds ratio is the ratio of the odds of having an outcome for one group versus another. When the odds ratio has the value 1, you have equal odds of having the outcome. When the odds ratio is greater than 1, one group has greater odds of an outcome than the other.
The odds ratio has a value of 2.62, which means that the odds of a complaint are 2.62 times higher for those children using the regular bandaid than for those using the test bandaid.
|
Chapter Contents |
Previous |
Next |
Top |
Copyright © 1999 by SAS Institute Inc., Cary, NC, USA. All rights reserved.