Chapter Contents
Previous
Next
|
Chapter Contents |
Previous |
Next |
| The FORECAST Procedure |
To use PROC FORECAST, specify the input and output data sets and the number of periods to forecast in the PROC FORECAST statement, then list the variables to forecast in a VAR statement.
For example, suppose you have monthly data on the sales of some product, in a data set, named PAST, as shown in Figure 12.1, and you want to forecast sales for the next 10 months.
The following statements forecast 10 observations for the variable SALES using the default STEPAR method and write the results to the output data set PRED:
   proc forecast data=past lead=10 out=pred;
      var sales;
   run;
The following statements use the PRINT procedure to print the data set PRED:
   proc print data=pred;
   run;
The PROC PRINT listing of the forecast data set PRED is shown in Figure 12.2.
|
If the ID variable contains SAS date values, the INTERVAL= option should be used on the PROC FORECAST statement to specify the time interval between observations. (See Chapter 3, "Date Intervals, Formats, and Functions," for more information on time intervals.) The FORECAST procedure uses the INTERVAL= option to generate correct dates for forecast observations.
The data set PAST, shown in Figure 12.1, has monthly observations and contains an ID variable DATE with SAS date values identifying each observation. The following statements produce the same forecast as the preceding example and also include the ID variable DATE in the output data set. Monthly SAS date values are extrapolated for the forecast observations.
   proc forecast data=past interval=month lead=10 out=pred;
      var sales;
      id date;
   run;
For example, the following statements use the OUTLIMIT option to write forecasts and 95% confidence limits for the variable SALES to the output data set PRED. This data set is printed with the PRINT procedure.
   proc forecast data=past interval=month lead=10
                 out=pred outlimit;
      var sales;
      id date;
   run;

   proc print data=pred;
   run;
The output data set PRED is shown in Figure 12.3.
|
The three observations for each forecast period have different values of the variable _TYPE_. For the _TYPE_=FORECAST observation, the value of the variable SALES is the forecast value for the period indicated by the DATE value. For the _TYPE_=L95 observation, the value of the variable SALES is the lower limit of the 95% confidence interval for the forecast. For the _TYPE_=U95 observation, the value of the variable SALES is the upper limit of the 95% confidence interval.
You can control the types of observations written to the OUT= data set with the PROC FORECAST statement options OUTLIMIT, OUTRESID, OUTACTUAL, OUT1STEP, OUTSTD, OUTFULL, and OUTALL. For example, the OUTFULL option outputs the confidence limit values, the one-step-ahead predictions, and the actual data, in addition to the forecast values. See the sections "Syntax" and "OUT= Data Set" later in this chapter for more information.
In this example, the OUTFULL option is used, and the resulting output data set contains the actual and predicted values, as well as the upper and lower 95
proc forecast data=past interval=month lead=10
out=pred outfull;
id date;
var sales;
run;
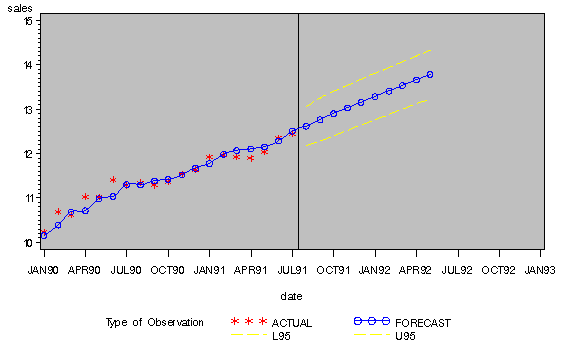
proc gplot data=pred;
plot sales * date = _type_ /
haxis= '1jan90'd to '1jan93'd by qtr
HREF='15jul91'd;
symbol1 i=none v=star; /* for _type_=ACTUAL */
symbol2 i=spline v=circle; /* for _type_=FORECAST */
symbol3 i=spline l=3; /* for _type_=L95 */
symbol4 i=spline l=3; /* for _type_=U95 */
where date >= '1jan90'd;
run;
The _TYPE_ variable is used in the GPLOT procedure's PLOT statement to make separate plots over time for each type of value. A reference line marks the start of the forecast period. (Refer to SAS/GRAPH Software: Reference, Volume 2, Version 7, First Edition for more information on using PROC GPLOT.) The WHERE statement restricts the range of the actual data shown in the plot. In this example, the variable SALES has monthly data from July 1989 through July 1991, but only the data for 1990 and 1991 are shown in the plot.
The plot is shown in Figure 12.4.
|
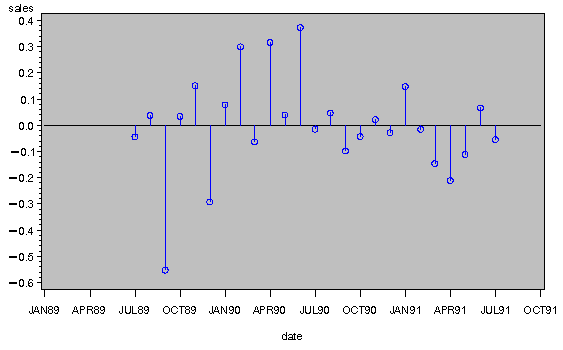
The following example adds the OUTRESID option to the preceding example and plots the residuals:
   proc forecast data=past interval=month lead=10
                 out=pred outfull outresid;
      id date;
      var sales;
   run;

   proc gplot data=pred;
      where _type_='RESIDUAL';
      plot sales * date /
           haxis= '1jan89'd to '1oct91'd by qtr;
      symbol1 i=circle;
   run;
The plot of residuals is shown in Figure 12.5.
|
For example, the following statements add the OUTEST= and OUTFITSTATS options to the previous example to create the output statistics data set EST for the results of the default stepwise autoregressive forecasting method:
   proc forecast data=past interval=month lead=10
                 out=pred outfull outresid
                 outest=est outfitstats;
      id date;
      var sales;
   run;

   proc print data=est;
   run;
The PRINT procedure prints the OUTEST= data set, as shown in Figure 12.6.
|
In the OUTEST= data set, the DATE variable contains the ID value of the last observation in the data set used to fit the forecasting model. The variable SALES contains the statistic indicated by the value of the _TYPE_ variable. The _TYPE_=N, NRESID, and DF observations contain, respectively, the number of observations read from the data set, the number of nonmissing residuals used to compute the goodness-of-fit statistics, and the number of nonmissing observations minus the number of parameters used in the forecasting model.
The observation having _TYPE_=SIGMA contains the estimate of the standard deviation of the one-step prediction error computed from the residuals. The _TYPE_=CONSTANT and _TYPE_=LINEAR contain the coefficients of the time trend regression. The _TYPE_=AR1, AR2, ..., AR8 observations contain the estimated autoregressive parameters. A missing autoregressive parameter indicates that the autoregressive term at that lag was not included in the model by the stepwise model selection method. (See the section "STEPAR Method" later in this chapter for more information.)
The other observations in the OUTEST= data set contain various goodness-of-fit statistics that measure how well the forecasting model used fits the given data. See "OUTEST= Data Set" later in this chapter for details.
   proc forecast data=past interval=month lead=10
                 method=expo trend=2
                 out=pred outfull outresid
                 outest=est outfitstats;
      var sales;
      id date;
   run;

   proc print data=est;
   run;
The PRINT procedure prints the OUTEST= data set for the EXPO method, as shown in Figure 12.7.
|
See the "Syntax" section later in this chapter for other options that control the forecasting method. See "Introduction to Forecasting Methods" and "Forecasting Methods" later in this chapter for an explanation of the different forecasting methods.
|
Chapter Contents |
Previous |
Next |
Top |
Copyright © 1999 by SAS Institute Inc., Cary, NC, USA. All rights reserved.