Chapter Contents
Previous
Next
|
Chapter Contents |
Previous |
Next |
| Forecasting Process Details |
This section summarizes the forecasting process.
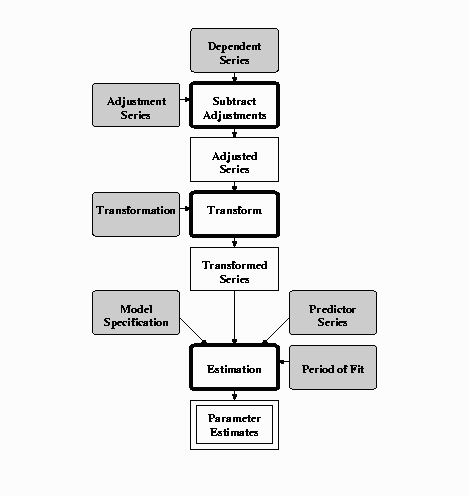
Figure 30.1: Model Fitting Flow Diagram

|
The specification of smoothing and ARIMA models is described in Chapter 25, "Specifying Forecasting Models,". Computational details for these kinds of models are provided in the following sections "Smoothing Models" and "ARIMA Models." The results of the parameter estimation process are displayed in the Parameter Estimates table of the Model Viewer window along with the estimate of the model variance and the final smoothing state.
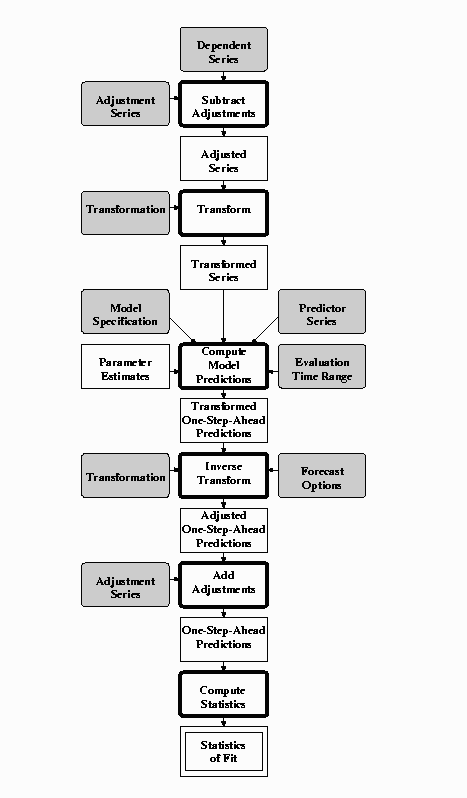
Figure 30.2: Model Evaluation Flow Diagram

|
Model evaluation is based on the one-step-ahead prediction errors for observations within the period of evaluation. The one-step-ahead predictions are generated from the model specification and parameter estimates. The predictions are inverse transformed (median or mean) and adjustments are removed. The prediction errors (the difference of the dependent series and the predictions) are used to compute the statistics of fit, which are described in the following section "Diagnostic Tests and Statistics of Fit." The results generated by the evaluation process are displayed in the Statistics of Fit table of the Model Viewer window.
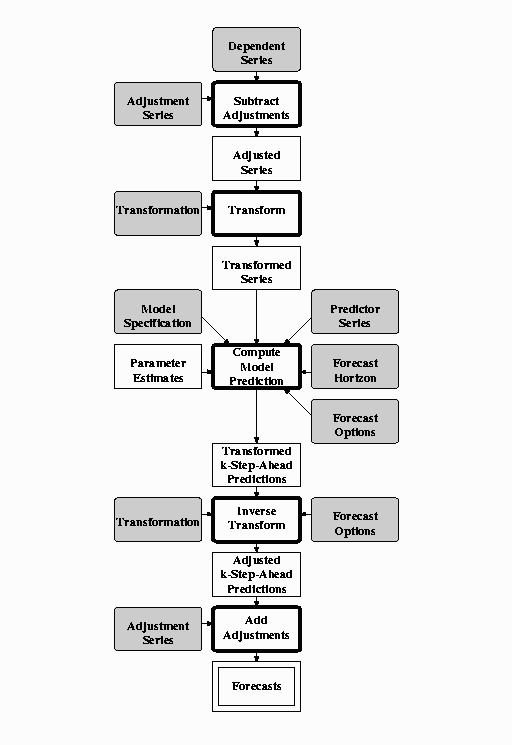
Figure 30.3: Forecasting Flow Diagram

|
The forecasting process is similar to the model evaluation process described in the preceding section, except that k-step-ahead predictions are made from the end of the data through the specified forecast horizon, and prediction standard errors and confidence limits are calculated. The forecasts and confidence limits are displayed in the Forecast plot or table of the Model Viewer window.
|
Chapter Contents |
Previous |
Next |
Top |
Copyright © 1999 by SAS Institute Inc., Cary, NC, USA. All rights reserved.