Chapter Contents
Previous
Next
|
Chapter Contents |
Previous |
Next |
| Transforming Variables |
The most common transformations are available in the Edit:Variables menu. For example, log transformations are commonly used to linearize relationships, stabilize variances, or reduce skewness. Perform a log transformation in a fit window by following these steps:
| Open the BASEBALL data set. |
| Create a fit analysis of SALARY versus CR_HOME. |
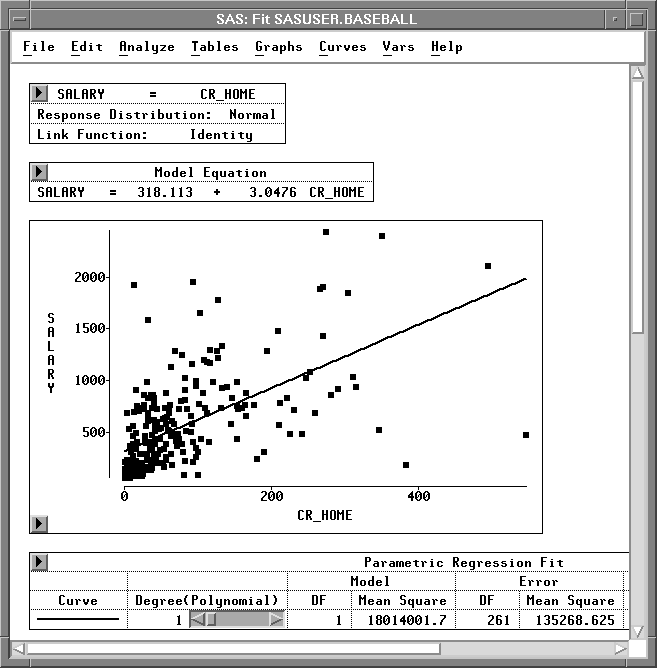
You might expect players who hit many home runs to receive high
salaries. However, most players do not hit many home runs, and
most do not have high salaries. This obscures the relationship
between SALARY and CR_HOME. Most of the observations appear
in the lower left corner of the scatter plot, and the regression
line does not fit the data well. To make the relationship
clearer, apply a logarithmic transformation.
| Select both variables in the scatter plot. |
Use your host's method for noncontiguous selection.

| Choose Edit:Variables:log(Y). |
![[menu]](images/traeq1.gif)
Figure 20.4: Edit:Variables Menu
This performs a log transformation on both SALARY and CR_HOME and transforms the scatter plot to a log-log plot. Now the regression fit is improved, and the relationship between salary and home run production is clearer.

The degrees of freedom (DF) is reduced from 261 to 258. This is due to missing values resulting from the log transformation, described in the following step.
| Scroll the data window to display the last four variables. |
Notice that in addition to residual and predicted values from the
regression, the log transformations created two new variables:
L_SALARY and L_CR_HOM.

The log transformation is useful in many cases. However, the result of log( Y ) is undefined where Y is less than or equal to 0. In such cases, SAS/INSIGHT software cannot transform the value, so a missing value (.) is generated. To see this, sort the data in the data window.
| Select L_CR_HOM in the data window, and choose Sort from the data pop-up menu. |

Missing values in the SAS System are considered to be less than any other value, so they appear first in the sorted variable. These values represent players who have never hit home runs. Their value for CR_HOME is 0, so the log of this value cannot be calculated. This means the log transformation has removed data from the fit analysis. The following steps circumvent this problem.
| Select CR_HOME in the data window. |

| Choose Edit:Variables:Other. |
![[menu]](images/traeq2.gif)
Figure 20.9: Edit:Variables Menu
This displays the Edit Variables dialog shown in Figure 20.10. In the dialog you can see that the variable CR_HOME is already assigned as the Y variable.
| Scroll down the transformation window, and select log( Y + a ). |

| In the field for a enter the value 1, then press the Return key. |
Notice that the Label value changes from log( CR_HOME ) to
log( CR_HOME + 1 ) to reflect the new value of a.
Setting a to 1 avoids the problem of generating missing
values because (CR_HOME + 1) is greater than zero in all
cases for this data.

| Click OK to perform the transformation. |
| Scroll all the way to the right to see the new variable, L_CR_H_1. |
Notice that the new variable contains no missing values.

| Select L_SALARY and L_CR_H_1, then choose Analyze:Fit (Y X). |
At the lower left corner of the scatter plot, you can see
observations that were not used in the previous fit analysis.
Also note that the degrees of freedom (DF) is back to 261.

Related Reading | Linear Models, Chapter 39. |
|
Chapter Contents |
Previous |
Next |
Top |
Copyright © 1999 by SAS Institute Inc., Cary, NC, USA. All rights reserved.