Output
To view or modify output options associated
with your contour plot, click on the Output
button of the rotating plot variables dialog.
This displays the options dialog in Figure 36.4.
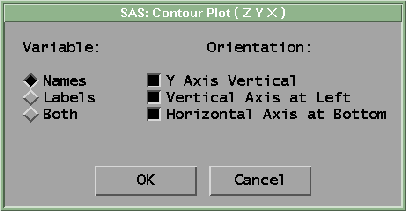
Figure 36.4: Contour Plot Output Options Dialog
| |
| Variable:Names | labels the axes with variable names. |
| Variable:Labels | labels the axes with variable labels. |
| Variable:Both | labels the axes with both names and labels. |
| Orientation:
Y Axis Vertical | draws the axis for the Y variable vertically.
If this option is turned off,
the Y axis is horizontal. |
| Orientation:
Vertical Axis at Left | places the vertical axis at the left side of the plot.
If this option is turned off,
the vertical axis appears at the right side of the plot. |
| Orientation:
Horizontal Axis at
Bottom | places the horizontal axis at the bottom of the plot.
If this option is turned off,
the horizontal axis appears at the top of the plot. |
You can modify other aspects of a contour plot by using the pop-up
menu.
![[menu]](images/ctreq1.gif)
Figure 36.5: Contour Plot Pop-up Menu
- Ticks...
- specifies tick labels on either axis.
- Axes
- toggles the display of axes.
- Observations
- toggles the display of observations.
When this menu is toggled off,
observations are displayed only if selected.
- Reference Lines
- toggles the display of lines that indicate the position
of major ticks on the axes.
This option is not available unless the axes are visible.
- Contour Lines
- toggles the display of contours (level curves).
- Labels
- toggles the display of contour level labels.
- Fill Areas
- toggles the display of filled contour areas.
When this menu item is toggled on, an area between two adjacent
contour levels is filled in with the color of the lower level.
- Color Blending
- applies color blending to all contour levels.
The color blend in the tools window is used.
- Marker Sizes
- sets the size of markers used to display observations.
You can select and brush observations in the contour
plot even when they are not visible.
If you click on a curve at the location of
an observation, you select that observation.
If you click on a contour curve between two observations,
you select the curve.
You can use the hand tool to add contour curves at new locations.
To add a new level curve, click at some (x, y) position; the level curve
that passes through that location is computed and displayed.
To move a contour level, drag on the level curve,
then release the mouse at a new location (x', y'). Mathematically, this
process results in seeing the level set that passes through
(x',y').
Finally, you can set colors, patterns, and widths of contour lines
the same way you set these attributes for curves.
See Chapter 13, "Fitting Curves," for examples of setting patterns,
widths, and colors. See also Chapter 11, "Coloring Observations," for
instructions on color blending.
Copyright © 1999 by SAS Institute Inc., Cary, NC, USA. All rights reserved.