Chapter Contents
Previous
Next
|
Chapter Contents |
Previous |
Next |
| Multivariate Analyses |
Clicking the Canonical Discriminant Options button in the Output Options dialog shown in Figure 40.5 displays the dialog shown in Figure 40.10.
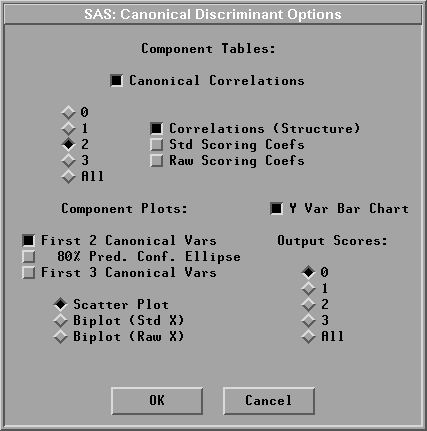
You specify the number of components when selecting tables of Correlations (Structure), Std Scoring Coefs, and Raw Scoring Coefs.
By default, SAS/INSIGHT software displays a plot of the first two canonical variables, a bar chart for the nominal Y variable, a canonical correlation table, and a table of correlations between the X variables and the first two canonical variables.
|
Chapter Contents |
Previous |
Next |
Top |
Copyright © 1999 by SAS Institute Inc., Cary, NC, USA. All rights reserved.