Chapter Contents
Chapter Contents
Previous
Previous
Next
Next
The NETFLOW Procedure

Example 4.4: Production, Inventory, Distribution Problem

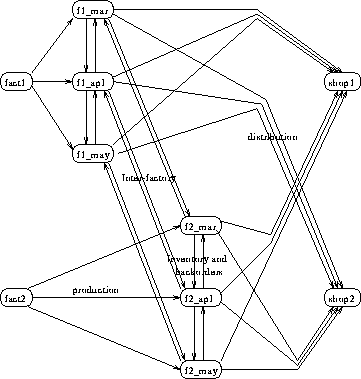
Example 4.4 through Example 4.8 use data from a company that produces two sizes of televisions in order to illustrate variations in the use the NETFLOW procedure. The company makes televisions with a diagonal screen measurement of either 19 inches or 25 inches. These televisions are made between March and May at both of the company's two factories. Each factory has a limit on the total number of televisions of each screen dimension that can be made during those months.

The televisions are distributed to one of two shops, stored at the factory where they were made and sold later, or shipped to the other factory. Some sets can be used to fill back orders from the previous months. Each shop demands a number of each type of TV for the months March through May. The following network in Figure 4.26 illustrates the model. Arc costs can be interpreted as production costs, storage costs, back order penalty costs, inter-factory transportation costs, and sales profits. The arcs can have capacities and lower flow bounds.

netps8.gif (5460 bytes)

Figure 4.26: TV problem

There are two similarly structured networks, one for the 19-inch televisions and the other for the 25-inch screen TVs. The minimum cost production, inventory, and distribution plan for both TV types can be determined in the same run of PROC NETFLOW. To ensure that node names are unambiguous, the names of nodes in the 19-inch network have suffix _1, and the node names in the 25-inch network have suffix _2.

The FUTURE1 option is specified because further processing could be required. Information concerning an optimal solution is retained so it can be used to warm start later optimizations. Warm start information is mostly in variables named _NNUMB_, _PRED_, _TRAV_, _SCESS_, _ARCID_, and _FBQ_ and in observations for nodes named _EXCESS_ and _ROOT_, that are in the NODEOUT=NODE2 output data set. (PROC NETFLOW uses similar devices to store warm start information in the DUALOUT= data set when the FUTURE2 option is specified.) Variables _ANUMB_ and _TNUMB_ and observations for arcs directed from or toward a node called _EXCESS_ are present in ARCOUT=arc1. (PROC NETFLOW uses similar devices to store warm start information in the CONOUT= data set when the FUTURE2 option is specified.)

The following code shows how to save the problem data in data sets and solve the model with PROC NETFLOW:

title 'Minimum Cost Flow problem';
title2 'Production Planning/Inventory/Distribution';
data node0;
   input _node_ $ _supdem_ ;
   datalines;
fact1_1   1000
fact2_1    850
fact1_2   1000
fact2_2   1500
shop1_1   -900
shop2_1   -900
shop1_2   -900
shop2_2  -1450
;
data arc0;
   input _tail_ $ _head_ $ _cost_ _capac_ _lo_ diagonal factory
         key_id $10. mth_made $ _name_&$17. ;
   datalines;
fact1_1  f1_mar_1  127.9  500 50 19 1 production March prod f1 19 mar
fact1_1  f1_apr_1   78.6  600 50 19 1 production April prod f1 19 apl
fact1_1  f1_may_1   95.1  400 50 19 1 production May   .
f1_mar_1 f1_apr_1   15     50  . 19 1 storage    March .
f1_apr_1 f1_may_1   12     50  . 19 1 storage    April .
f1_apr_1 f1_mar_1   28     20  . 19 1 backorder  April back f1 19 apl
f1_may_1 f1_apr_1   28     20  . 19 1 backorder  May   back f1 19 may
f1_mar_1 f2_mar_1   11      .  . 19 . f1_to_2    March .
f1_apr_1 f2_apr_1   11      .  . 19 . f1_to_2    April .
f1_may_1 f2_may_1   16      .  . 19 . f1_to_2    May   .
f1_mar_1 shop1_1  -327.65 250  . 19 1 sales      March .
f1_apr_1 shop1_1  -300    250  . 19 1 sales      April .
f1_may_1 shop1_1  -285    250  . 19 1 sales      May   .
f1_mar_1 shop2_1  -362.74 250  . 19 1 sales      March .
f1_apr_1 shop2_1  -300    250  . 19 1 sales      April .
f1_may_1 shop2_1  -245    250  . 19 1 sales      May   .
fact2_1  f2_mar_1   88.0  450 35 19 2 production March prod f2 19 mar
fact2_1  f2_apr_1   62.4  480 35 19 2 production April prod f2 19 apl
fact2_1  f2_may_1  133.8  250 35 19 2 production May   .
f2_mar_1 f2_apr_1   18     30  . 19 2 storage    March .
f2_apr_1 f2_may_1   20     30  . 19 2 storage    April .
f2_apr_1 f2_mar_1   17     15  . 19 2 backorder  April back f2 19 apl
f2_may_1 f2_apr_1   25     15  . 19 2 backorder  May   back f2 19 may
f2_mar_1 f1_mar_1   10     40  . 19 . f2_to_1    March .
f2_apr_1 f1_apr_1   11     40  . 19 . f2_to_1    April .
f2_may_1 f1_may_1   13     40  . 19 . f2_to_1    May   .
f2_mar_1 shop1_1  -297.4  250  . 19 2 sales      March .
f2_apr_1 shop1_1  -290    250  . 19 2 sales      April .
f2_may_1 shop1_1  -292    250  . 19 2 sales      May   .
f2_mar_1 shop2_1  -272.7  250  . 19 2 sales      March .
f2_apr_1 shop2_1  -312    250  . 19 2 sales      April .
f2_may_1 shop2_1  -299    250  . 19 2 sales      May   .
fact1_2  f1_mar_2  217.9  400 40 25 1 production March prod f1 25 mar
fact1_2  f1_apr_2  174.5  550 50 25 1 production April prod f1 25 apl
fact1_2  f1_may_2  133.3  350 40 25 1 production May   .
f1_mar_2 f1_apr_2   20     40  . 25 1 storage    March .
f1_apr_2 f1_may_2   18     40  . 25 1 storage    April .
f1_apr_2 f1_mar_2   32     30  . 25 1 backorder  April back f1 25 apl
f1_may_2 f1_apr_2   41     15  . 25 1 backorder  May   back f1 25 may
f1_mar_2 f2_mar_2   23      .  . 25 . f1_to_2    March .
f1_apr_2 f2_apr_2   23      .  . 25 . f1_to_2    April .
f1_may_2 f2_may_2   26      .  . 25 . f1_to_2    May   .
f1_mar_2 shop1_2  -559.76   .  . 25 1 sales      March .
f1_apr_2 shop1_2  -524.28   .  . 25 1 sales      April .
f1_may_2 shop1_2  -475.02   .  . 25 1 sales      May   .
f1_mar_2 shop2_2  -623.89   .  . 25 1 sales      March .
f1_apr_2 shop2_2  -549.68   .  . 25 1 sales      April .
f1_may_2 shop2_2  -460.00   .  . 25 1 sales      May   .
fact2_2  f2_mar_2  182.0  650 35 25 2 production March prod f2 25 mar
fact2_2  f2_apr_2  196.7  680 35 25 2 production April prod f2 25 apl
fact2_2  f2_may_2  201.4  550 35 25 2 production May   .
f2_mar_2 f2_apr_2   28     50  . 25 2 storage    March .
f2_apr_2 f2_may_2   38     50  . 25 2 storage    April .
f2_apr_2 f2_mar_2   31     15  . 25 2 backorder  April back f2 25 apl
f2_may_2 f2_apr_2   54     15  . 25 2 backorder  May   back f2 25 may
f2_mar_2 f1_mar_2   20     25  . 25 . f2_to_1    March .
f2_apr_2 f1_apr_2   21     25  . 25 . f2_to_1    April .
f2_may_2 f1_may_2   43     25  . 25 . f2_to_1    May   .
f2_mar_2 shop1_2  -567.83 500  . 25 2 sales      March .
f2_apr_2 shop1_2  -542.19 500  . 25 2 sales      April .
f2_may_2 shop1_2  -461.56 500  . 25 2 sales      May   .
f2_mar_2 shop2_2  -542.83 500  . 25 2 sales      March .
f2_apr_2 shop2_2  -559.19 500  . 25 2 sales      April .
f2_may_2 shop2_2  -489.06 500  . 25 2 sales      May   .
;
 proc netflow
        nodedata=node0
        arcdata=arc0;
    set future1
        nodeout=node2
        arcout=arc1;
proc print data=arc1; sum _fcost_;
proc print data=node2;
run;

The following notes appear on the SAS log:

NOTE: Number of nodes= 20 .
NOTE: Number of supply nodes= 4 .
NOTE: Number of demand nodes= 4 .
NOTE: Total supply= 4350 , total demand= 4150 .
NOTE: Number of arcs= 64 .
NOTE: Number of iterations performed (neglecting any 
      constraints)= 74 .
NOTE: Of these, 1 were degenerate.
NOTE: Optimum (neglecting any constraints) found.
NOTE: Minimal total cost= -1281110.35 .
NOTE: The data set WORK.ARC1 has 68 observations and 
      18 variables.
NOTE: The data set WORK.NODE2 has 22 observations and 
      10 variables.

The solution is given in the NODEOUT=node2 and ARCOUT=arc1 data sets. In the ARCOUT= data set, shown in Output 4.4.1, the variables diagonal, factory, key_id, and mth_made form an implicit ID list. The diagonal variable has one of two values, 19 or 25. factory also has one of two values, 1 or 2, to denote the factory where either production or storage occurs, from where TVs are either sold to shops or satisfy back orders. PRODUCTION, STORAGE, SALES, and BACKORDER are values of the key_id variable.

Other values of this variable, F1_TO_2 and F2_TO_1, are used when flow through arcs represents the transportation of TVs between factories. The mth_made variable has values MARCH, APRIL, and MAY, the months when TVs that are modeled as flow through an arc were made (assuming that no televisions are stored for more than one month and none manufactured in May are used to fill March back orders).

These ID variables can be used after the PROC NETFLOW run to produce reports and perform analysis on particular parts of the company's operation. For example, reports can be generated for production numbers for each factory; optimal sales figures for each shop; and how many TVs should be stored, used to fill back orders, sent to the other factory, or any combination of these, for TVs with a particular screen, those produced in a particular month, or both.

Output 4.4.1: ARCOUT=ARC1

Minimum Cost Flow problem
Production Planning/Inventory/Distribution

Obs _tail_ _head_ _cost_ _capac_ _lo_ _name_ _SUPPLY_ _DEMAND_ _FLOW_ _FCOST_ _RCOST_ _ANUMB_ _TNUMB_ _STATUS_ diagonal factory key_id mth_made
1 fact1_1 _EXCESS_ 0.00 99999999 0   1000 200 5 0.00 . 65 1 KEY_ARC BASIC . .    
2 fact2_1 _EXCESS_ 0.00 99999999 0   850 200 45 0.00 . 66 10 KEY_ARC BASIC . .    
3 fact1_2 _EXCESS_ 0.00 99999999 0   1000 200 10 0.00 . 67 11 KEY_ARC BASIC . .    
4 fact2_2 _EXCESS_ 0.00 99999999 0   1500 200 140 0.00 . 68 20 KEY_ARC BASIC . .    
5 fact1_1 f1_apr_1 78.60 600 50 prod f1 19 apl 1000 . 600 47160.00 -0.650 4 1 UPPERBD NONBASIC 19 1 production April
6 f1_mar_1 f1_apr_1 15.00 50 0   . . 0 0.00 63.650 5 2 LOWERBD NONBASIC 19 1 storage March
7 f1_may_1 f1_apr_1 28.00 20 0 back f1 19 may . . 0 0.00 43.000 6 4 LOWERBD NONBASIC 19 1 backorder May
8 f2_apr_1 f1_apr_1 11.00 40 0   . . 0 0.00 22.000 7 6 LOWERBD NONBASIC 19 . f2_to_1 April
9 fact1_2 f1_apr_2 174.50 550 50 prod f1 25 apl 1000 . 550 95975.00 -14.350 36 11 UPPERBD NONBASIC 25 1 production April
10 f1_mar_2 f1_apr_2 20.00 40 0   . . 0 0.00 94.210 37 12 LOWERBD NONBASIC 25 1 storage March
11 f1_may_2 f1_apr_2 41.00 15 0 back f1 25 may . . 15 615.00 -16.660 38 14 UPPERBD NONBASIC 25 1 backorder May
12 f2_apr_2 f1_apr_2 21.00 25 0   . . 0 0.00 30.510 39 16 LOWERBD NONBASIC 25 . f2_to_1 April
13 fact1_1 f1_mar_1 127.90 500 50 prod f1 19 mar 1000 . 345 44125.50 . 1 1 KEY_ARC BASIC 19 1 production March
14 f1_apr_1 f1_mar_1 28.00 20 0 back f1 19 apl . . 20 560.00 -20.650 2 3 UPPERBD NONBASIC 19 1 backorder April
15 f2_mar_1 f1_mar_1 10.00 40 0   . . 40 400.00 -29.900 3 5 UPPERBD NONBASIC 19 . f2_to_1 March
16 fact1_2 f1_mar_2 217.90 400 40 prod f1 25 mar 1000 . 400 87160.00 -45.160 33 11 UPPERBD NONBASIC 25 1 production March
17 f1_apr_2 f1_mar_2 32.00 30 0 back f1 25 apl . . 30 960.00 -42.210 34 13 UPPERBD NONBASIC 25 1 backorder April
18 f2_mar_2 f1_mar_2 20.00 25 0   . . 25 500.00 -61.060 35 15 UPPERBD NONBASIC 25 . f2_to_1 March
19 fact1_1 f1_may_1 95.10 400 50   1000 . 50 4755.00 0.850 8 1 LOWERBD NONBASIC 19 1 production May
20 f1_apr_1 f1_may_1 12.00 50 0   . . 50 600.00 -3.000 9 3 UPPERBD NONBASIC 19 1 storage April
21 f2_may_1 f1_may_1 13.00 40 0   . . 0 0.00 29.000 10 7 LOWERBD NONBASIC 19 . f2_to_1 May
22 fact1_2 f1_may_2 133.30 350 40   1000 . 40 5332.00 2.110 40 11 LOWERBD NONBASIC 25 1 production May
23 f1_apr_2 f1_may_2 18.00 40 0   . . 0 0.00 75.660 41 13 LOWERBD NONBASIC 25 1 storage April
24 f2_may_2 f1_may_2 43.00 25 0   . . 0 0.00 40.040 42 17 LOWERBD NONBASIC 25 . f2_to_1 May
25 f1_apr_1 f2_apr_1 11.00 99999999 0   . . 30 330.00 . 14 3 KEY_ARC BASIC 19 . f1_to_2 April
26 fact2_1 f2_apr_1 62.40 480 35 prod f2 19 apl 850 . 480 29952.00 -27.850 15 10 UPPERBD NONBASIC 19 2 production April
27 f2_mar_1 f2_apr_1 18.00 30 0   . . 0 0.00 15.750 16 5 LOWERBD NONBASIC 19 2 storage March
28 f2_may_1 f2_apr_1 25.00 15 0 back f2 19 may . . 0 0.00 45.000 17 7 LOWERBD NONBASIC 19 2 backorder May
29 f1_apr_2 f2_apr_2 23.00 99999999 0   . . 0 0.00 13.490 46 13 LOWERBD NONBASIC 25 . f1_to_2 April
30 fact2_2 f2_apr_2 196.70 680 35 prod f2 25 apl 1500 . 680 133756.00 -1.660 47 20 UPPERBD NONBASIC 25 2 production April
31 f2_mar_2 f2_apr_2 28.00 50 0   . . 0 0.00 11.640 48 15 LOWERBD NONBASIC 25 2 storage March
32 f2_may_2 f2_apr_2 54.00 15 0 back f2 25 may . . 15 810.00 -16.130 49 17 UPPERBD NONBASIC 25 2 backorder May
33 f1_mar_1 f2_mar_1 11.00 99999999 0   . . 0 0.00 50.900 11 2 LOWERBD NONBASIC 19 . f1_to_2 March
34 fact2_1 f2_mar_1 88.00 450 35 prod f2 19 mar 850 . 290 25520.00 . 12 10 KEY_ARC BASIC 19 2 production March
35 f2_apr_1 f2_mar_1 17.00 15 0 back f2 19 apl . . 0 0.00 19.250 13 6 LOWERBD NONBASIC 19 2 backorder April
36 f1_mar_2 f2_mar_2 23.00 99999999 0   . . 0 0.00 104.060 43 12 LOWERBD NONBASIC 25 . f1_to_2 March
37 fact2_2 f2_mar_2 182.00 650 35 prod f2 25 mar 1500 . 645 117390.00 . 44 20 KEY_ARC BASIC 25 2 production March
38 f2_apr_2 f2_mar_2 31.00 15 0 back f2 25 apl . . 0 0.00 47.360 45 16 LOWERBD NONBASIC 25 2 backorder April
39 f1_may_1 f2_may_1 16.00 99999999 0   . . 100 1600.00 . 18 4 KEY_ARC BASIC 19 . f1_to_2 May
40 fact2_1 f2_may_1 133.80 250 35   850 . 35 4683.00 23.550 19 10 LOWERBD NONBASIC 19 2 production May
41 f2_apr_1 f2_may_1 20.00 30 0   . . 15 300.00 . 20 6 KEY_ARC BASIC 19 2 storage April
42 f1_may_2 f2_may_2 26.00 99999999 0   . . 0 0.00 28.960 50 14 LOWERBD NONBASIC 25 . f1_to_2 May
43 fact2_2 f2_may_2 201.40 550 35   1500 . 35 7049.00 73.170 51 20 LOWERBD NONBASIC 25 2 production May
44 f2_apr_2 f2_may_2 38.00 50 0   . . 0 0.00 108.130 52 16 LOWERBD NONBASIC 25 2 storage April
45 f1_mar_1 shop1_1 -327.65 250 0   . 900 155 -50785.75 . 21 2 KEY_ARC BASIC 19 1 sales March
46 f1_apr_1 shop1_1 -300.00 250 0   . 900 250 -75000.00 -21.000 22 3 UPPERBD NONBASIC 19 1 sales April
47 f1_may_1 shop1_1 -285.00 250 0   . 900 0 0.00 9.000 23 4 LOWERBD NONBASIC 19 1 sales May
48 f2_mar_1 shop1_1 -297.40 250 0   . 900 250 -74350.00 -9.650 24 5 UPPERBD NONBASIC 19 2 sales March
49 f2_apr_1 shop1_1 -290.00 250 0   . 900 245 -71050.00 . 25 6 KEY_ARC BASIC 19 2 sales April
50 f2_may_1 shop1_1 -292.00 250 0   . 900 0 0.00 18.000 26 7 LOWERBD NONBASIC 19 2 sales May
51 f1_mar_2 shop1_2 -559.76 99999999 0   . 900 0 0.00 47.130 53 12 LOWERBD NONBASIC 25 1 sales March
52 f1_apr_2 shop1_2 -524.28 99999999 0   . 900 0 0.00 8.400 54 13 LOWERBD NONBASIC 25 1 sales April
53 f1_may_2 shop1_2 -475.02 99999999 0   . 900 25 -11875.50 . 55 14 KEY_ARC BASIC 25 1 sales May
54 f2_mar_2 shop1_2 -567.83 500 0   . 900 500 -283915.00 -42.000 56 15 UPPERBD NONBASIC 25 2 sales March
55 f2_apr_2 shop1_2 -542.19 500 0   . 900 375 -203321.25 . 57 16 KEY_ARC BASIC 25 2 sales April
56 f2_may_2 shop1_2 -461.56 500 0   . 900 0 0.00 10.500 58 17 LOWERBD NONBASIC 25 2 sales May
57 f1_mar_1 shop2_1 -362.74 250 0   . 900 250 -90685.00 -46.090 27 2 UPPERBD NONBASIC 19 1 sales March
58 f1_apr_1 shop2_1 -300.00 250 0   . 900 250 -75000.00 -32.000 28 3 UPPERBD NONBASIC 19 1 sales April
59 f1_may_1 shop2_1 -245.00 250 0   . 900 0 0.00 38.000 29 4 LOWERBD NONBASIC 19 1 sales May
60 f2_mar_1 shop2_1 -272.70 250 0   . 900 0 0.00 4.050 30 5 LOWERBD NONBASIC 19 2 sales March
61 f2_apr_1 shop2_1 -312.00 250 0   . 900 250 -78000.00 -33.000 31 6 UPPERBD NONBASIC 19 2 sales April
62 f2_may_1 shop2_1 -299.00 250 0   . 900 150 -44850.00 . 32 7 KEY_ARC BASIC 19 2 sales May
63 f1_mar_2 shop2_2 -623.89 99999999 0   . 1450 455 -283869.95 . 59 12 KEY_ARC BASIC 25 1 sales March
64 f1_apr_2 shop2_2 -549.68 99999999 0   . 1450 535 -294078.80 . 60 13 KEY_ARC BASIC 25 1 sales April
65 f1_may_2 shop2_2 -460.00 99999999 0   . 1450 0 0.00 32.020 61 14 LOWERBD NONBASIC 25 1 sales May
66 f2_mar_2 shop2_2 -542.83 500 0   . 1450 120 -65139.60 . 62 15 KEY_ARC BASIC 25 2 sales March
67 f2_apr_2 shop2_2 -559.19 500 0   . 1450 320 -178940.80 . 63 16 KEY_ARC BASIC 25 2 sales April
68 f2_may_2 shop2_2 -489.06 500 0   . 1450 20 -9781.20 . 64 17 KEY_ARC BASIC 25 2 sales May
                    -1281110.35                

Output 4.4.2: NODEOUT=NODE2

Obs _node_ _supdem_ _DUAL_ _NNUMB_ _PRED_ _TRAV_ _SCESS_ _ARCID_ _FLOW_ _FBQ_
1 _ROOT_ 238 0.00 22 0 8 0 3 166 -69
2 _EXCESS_ -200 -100000198.75 21 1 11 13 65 5 65
3 f1_apr_1 . -100000278.00 3 6 7 1 -14 30 4
4 f1_apr_2 . -100000387.60 13 19 17 1 -60 535 36
5 f1_mar_1 . -100000326.65 2 8 1 15 -21 155 1
6 f1_mar_2 . -100000461.81 12 19 13 1 -59 455 33
7 f1_may_1 . -100000293.00 4 7 2 1 -18 100 8
8 f1_may_2 . -100000329.94 14 18 12 1 -55 25 40
9 f2_apr_1 . -100000289.00 6 8 3 5 -25 245 14
10 f2_apr_2 . -100000397.11 16 19 18 3 -63 320 46
11 f2_mar_1 . -100000286.75 5 10 22 1 12 255 11
12 f2_mar_2 . -100000380.75 15 20 19 8 44 610 43
13 f2_may_1 . -100000309.00 7 6 9 3 20 15 18
14 f2_may_2 . -100000326.98 17 19 10 1 -64 20 50
15 fact1_1 1000 -100000198.75 1 2 21 14 -1 295 -1
16 fact1_2 1000 -100000198.75 11 21 20 1 -67 10 -33
17 fact2_1 850 -100000198.75 10 21 5 2 -66 45 -33
18 fact2_2 1500 -100000198.75 20 21 15 9 -68 140 -65
19 shop1_1 -900 -99999999.00 8 22 6 21 0 0 21
20 shop1_2 -900 -99999854.92 18 16 14 2 57 375 53
21 shop2_1 -900 -100000010.00 9 7 4 1 32 150 27
22 shop2_2 -1450 -99999837.92 19 15 16 7 62 120 59

Chapter Contents
Chapter Contents
Previous
Previous
Next
Next
Top
Top

Copyright © 1999 by SAS Institute Inc., Cary, NC, USA. All rights reserved.