Chapter Contents
Chapter Contents
Previous
Previous
Next
Next
The GANTT Procedure

Example 4.19: Specifying the Logic Control Options

This example illustrates four options that control the routing of a precedence connection from an activity to its successor on the logic Gantt chart. The example also illustrates the drawing of a Logic Gantt chart using the Activity-on-Arc format.

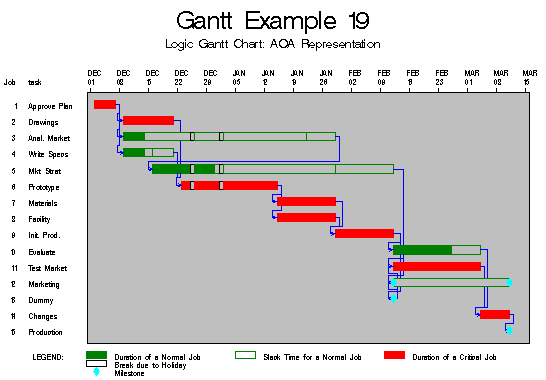
The Activity data set for PROC CPM is the WIDGETA data set from Example 2.2, which defines the widget manufacturing project in AOA format. The project is scheduled subject to weekends, and the holidays are defined in the HOLDATA data set. The resulting schedule is stored in the output data set SAVEHP. The GANTT procedure is next invoked to produce a Logic Gantt chart by specifying the HEAD= and TAIL= options in the CHART statement. The TRIPLEX font is used for all text except for the first TITLE by specifying it globally using the FTEXT= option in a GOPTIONS statement. The same effect could have been obtained by specifying the TRIPLEX font using the FONT= option in the CHART statement and the F= option in the TITLE2 statement. The resulting Logic Gantt chart is shown in Output 4.19.1.

   title f=swiss 'Gantt Example 19';

   data holdata;
      format hol date7.;
      input hol date7.;
      datalines;
   25dec91
   01jan92
   ;

   * schedule the project subject to holidays and weekends;

   proc cpm data=widgeta holidata=holdata out=savehp
            date='2dec91'd interval=weekday;
      tailnode tail;
      headnode head;
      duration days;
      holiday  hol;
      id task dept descrpt;
   run;


   * sort the schedule by the early start date ;

   proc sort;
      by e_start;
   run;


   * set background to white, text to black and font to triplex;

   goptions cback=white ctext=black ftext=triplex;


   * set vpos to 50 and hpos to 100;

   goptions vpos=50 hpos=100;


   * set up required pattern statements;

   pattern1 c=green v=s;  /* duration of a noncrit. activity  */
   pattern2 c=green v=e;  /* slack time for a noncrit. act.   */
   pattern3 c=red   v=s;  /* duration of a critical activity  */
   pattern4 c=red   v=e;  /* slack time for a supercrit. act. */
   pattern5 c=red   v=r2; /* duration of a supercrit. act.    */
   pattern6 c=cyan  v=s;  /* actual duration of an activity   */
   pattern7 c=blue  v=x1; /* break due to a holiday           */


   * plot the Logic Gantt chart using AOA representation;

   title2 'Logic Gantt Chart: AOA Representation';

   proc gantt data=savehp holidata=holdata;
      chart / holiday=(hol) dur=days increment=7 compress
           caxis=black cmile=cyan cprec=blue
           head=head tail=tail;
      id task;
   run;

Output 4.19.1: Logic Gantt Chart: AOA Representation
ga19p1.gif (6264 bytes)

The next invocation of PROC GANTT illustrates the effect of the MININTGV= and MINOFFGV= options, which control placement of the global verticals. The concept of global verticals is explained in the "Specifying the Logic Options" section. The data sets from the previous invocation of the GANTT procedure remain unchanged. The minimum distance of a global vertical from the end of the bar it is associated with is increased from its default of 1 cell to 2.5 cells by specifying MINOFFGV=2.5 . Likewise, the minimum distance between any two global verticals is increased from its default of .75 cells to 2 cells by specifying MININTGV=2.0 . The effects of these changes are visible in the resulting Logic Gantt chart shown in Output 4.19.2.

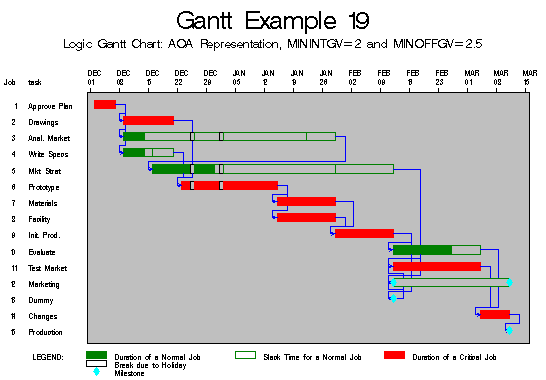
   * illustrate the minintgv and minoffgv options;

   title2
   'Logic Gantt Chart: AOA Representation, MININTGV=2 and MINOFFGV=2.5';

   proc gantt data=savehp holidata=holdata;
      chart / holiday=(hol) dur=days increment=7 compress
              caxis=black cmile=cyan cprec=blue
              head=head tail=tail
              minintgv=2.0 minoffgv=2.5;
      id task;
   run;

Notice that now there is greater distance between vertical segments (corresponding to global verticals), and the horizontal segments leaving bars are longer.

Output 4.19.2: Specifying the MININTGV= and MINOFFGV= Options
ga19p2.gif (6709 bytes)

The MAXDATE= option is specified in the remaining Gantt calls in this example in order to focus on the schedule bars of the first few activities in the chart. The next two outputs illustrate the use of the MAXDISLV= option in the CHART statement. The MAXDISLV= option is used as a safeguard to limit the feasible region made available to PROC GANTT for placement of local verticals. The value specified dictates the maximum allowable displacement of the local vertical from its ideal position, that is, at a distance of MINOFFLV= from the end of the bar with which it is associated. However, this ideal position may tend to be positioned too close to a global vertical or even coincide with one. Depending on the cell width, this can result in visual misinterpretation of the Logic Gantt chart. In order to avoid this scenario, you should specify a reasonable value for the MAXDISLV= option to permit a certain amount of freedom for local vertical placement so as to distinguish between local and global verticals. Typically, use of this option is desirable when the value of the MININTGV= option, the minimum distance between global verticals, is relatively much greater than the value of the MAXDISLV= option. To illustrate, consider the following Gantt call with a large MININTGV= value (10) and a relatively smaller MAXDISLV= value (0.3) . Thus, for every local vertical, PROC GANTT has a very small interval that is less than a third of a cell wide in which to place that local vertical regardless of whether a global vertical runs through that interval or not. The result of this constraint is illustrated in the chart shown in Output 4.19.3. The local vertical for 'Drawings' is positioned as far as possible from the global vertical of 'Approve Plan', but the value of the MAXDISLV= option restricts it from being positioned any further. Visually it is not pleasing, and it is difficult to distinguish the local and global verticals. A similar situation is evident with the local vertical of 'Prototype' and the global vertical of 'Write Specs' .

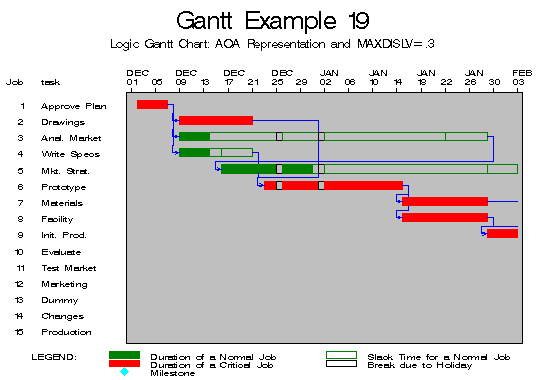
   * illustrate the maxdislv option;

   title2
      'Logic Gantt Chart: AOA Representation and MAXDISLV=.3';

   proc gantt data=savehp holidata=holdata;
      chart / holiday=(hol) dur=days compress
              caxis=black cmile=cyan cprec=blue
              head=head tail=tail
              maxdislv=.3 minintgv=10
              maxdate='01feb92'd;
      id task;
   run;

Output 4.19.3: Specifying the MAXDISLV= Option (I)
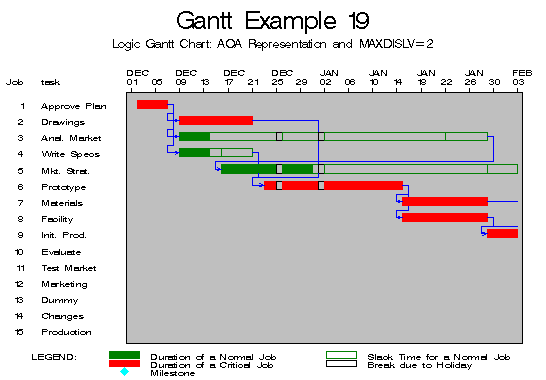
ga19p3.gif (6107 bytes)

By reducing the value of MAXDISLV= even further, you can produce a chart that gives the appearance of a local vertical overlapping with a global vertical owing to resolution limitations of the display device. Theoretically, by design, this will never be the case. Recall that the value of the MAXDISLV= option is strictly positive and is at least a tenth of a cell width. The solution to this problem is to increase the value of the MAXDISLV= option so that the local vertical can be displaced further away from any adjacent global verticals. In the next invocation of PROC GANTT, the value of the MAXDISLV= option is increased to 2, resulting in a Logic Gantt chart in which the local verticals are staggered further away from nearby global verticals.

   title2
      'Logic Gantt Chart: AOA Representation and MAXDISLV=2';

   proc gantt data=savehp holidata=holdata;
      chart / holiday=(hol) dur=days compress
              caxis=black cmile=cyan cprec=blue
              head=head tail=tail
              maxdislv=2 minintgv=10
              maxdate='01feb92'd;
      id task;
   run;

Output 4.19.4: Specifying the MAXDISLV= Option (II)
ga19p4.gif (6138 bytes)

The final Gantt chart in this example illustrates the use of the MINOFFLV= option in the CHART statement. This option specifies the minimum distance of a local vertical from the end of the bar with which it is associated. Although the position corresponding to the MINOFFLV= option is the position of choice for placement of the local vertical, the actual placement can differ from this position owing to the presence of nearby global verticals, as illustrated by the two previous Gantt charts. The maximum amount of displacement is determined by the value of the MAXDISLV= option.

In all of the preceding charts in this example, the connection from the activity, 'Approve Plan', to each of its three successors, 'Drawings', 'Anal. Market', and 'Write Specs', is a 5-segment connection similar to the type illustrated in Figure 4.11. This is caused by backtracking of the activity's global vertical to the successor's local vertical as described in the "Controlling the Layout" section. To transform this connection into a 3-segment connection as shown in Figure 4.10, you need to position the local vertical to the right of the global vertical. The following invocation of PROC GANTT achieves this by specifying MINOFFLV=0.5. Notice that this option affects the positioning of all local verticals on the chart in contrast to the MAXDISLV= option, which affects only those local verticals that are close to global verticals.

   * illustrate the minofflv option;

   title2
      'Logic Gantt Chart: AOA Representation and MINOFFLV=.5';

   proc gantt data=savehp holidata=holdata;
      chart / holiday=(hol) dur=days compress
              caxis=black cmile=cyan cprec=blue
              head=head tail=tail
              minofflv=.5
              maxdate='01feb92'd;
      id task;
   run;

Output 4.19.5: Specifying the MINOFFLV= Option
ga19p5.gif (6077 bytes)

Chapter Contents
Chapter Contents
Previous
Previous
Next
Next
Top
Top

Copyright © 1999 by SAS Institute Inc., Cary, NC, USA. All rights reserved.