Chapter Contents
Previous
Next
|
Chapter Contents |
Previous |
Next |
| QQPLOT Statement |
| See CAPQQ2 in the SAS/QC Sample Library |
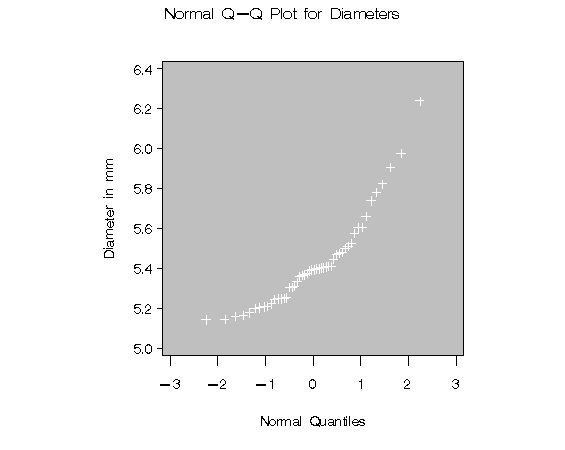
The following statements produce the normal Q-Q plot in Output 10.1.1:
   data measures;
      input diameter @@;
      label diameter='Diameter in mm';
      datalines;
    5.501  5.251  5.404  5.366  5.445  5.576  5.607
    5.200  5.977  5.177  5.332  5.399  5.661  5.512
    5.252  5.404  5.739  5.525  5.160  5.410  5.823
    5.376  5.202  5.470  5.410  5.394  5.146  5.244
    5.309  5.480  5.388  5.399  5.360  5.368  5.394
    5.248  5.409  5.304  6.239  5.781  5.247  5.907
    5.208  5.143  5.304  5.603  5.164  5.209  5.475
    5.223
   ;
   title 'Normal Q-Q Plot for Diameters';
   proc capability data=measures noprint;
      qqplot diameter / normal
                        square
                        vaxis=axis1
                        cframe = ligr;
      axis1 label=(a=90 r=0);
   run;
Output 10.1.1: Normal Quantile-Quantile Plot of Nonnormal Data
|
|
Chapter Contents |
Previous |
Next |
Top |
Copyright © 1999 by SAS Institute Inc., Cary, NC, USA. All rights reserved.