Chapter Contents
Previous
Next
|
Chapter Contents |
Previous |
Next |
| CDFPLOT Statement |
| See CAPCDF1 in the SAS/QC Sample Library |
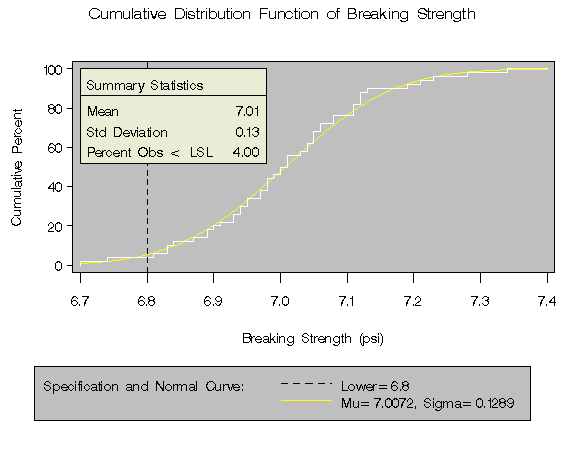
You can use the CDFPLOT statement to fit any of six theoretical distributions (beta, exponential, gamma, lognormal, normal, and Weibull) and superimpose them on the cdf plot. The following statements use the NORMAL option to display a fitted normal distribution function on a cdf plot of breaking strengths. The data set CORD is given in Figure 2.1, and the plot is shown in Output 2.1.1.
   title 'Cumulative Distribution Function of Breaking Strength';
   legend1 frame cframe=ligr cborder=black position=center;
   proc capability data=cord noprint;
      spec lsl=6.8 llsl=2 clsl=black;
      cdf strength /  normal(color=yellow)
                      vaxis  = axis1
                      cframe = ligr
                      legend = legend1;
      inset mean std pctlss  / cfill  = blank
                               format = 5.2
                               header = "Summary Statistics";
      axis1 label=(a=90 r=0);
   run;
Output 2.1.1: Superimposed Normal Distribution Function
|
The agreement between the empirical and the normal distribution functions in Output 2.1.1 is evidence that the normal distribution is an appropriate model for the distribution of breaking strengths.
The CAPABILITY procedure provides a variety of other tools for assessing goodness of fit. Goodness-of-fit tests (see "Printed Output" ) provide a quantitative assessment of a proposed distribution. Probability and Q-Q plots, created with the PROBPLOT ( Chapter 9, "PROBPLOT Statement"), QQPLOT ( Chapter 10, "QQPLOT Statement"), and PPPLOT ( Chapter 8, "PPPLOT Statement") statements, provide effective graphical diagnostics.
|
Chapter Contents |
Previous |
Next |
Top |
Copyright © 1999 by SAS Institute Inc., Cary, NC, USA. All rights reserved.