Chapter Contents
Previous
Next
|
Chapter Contents |
Previous |
Next |
| COMPHISTOGRAM Statement |
| See CAPCMH1 in the SAS/QC Sample Library |
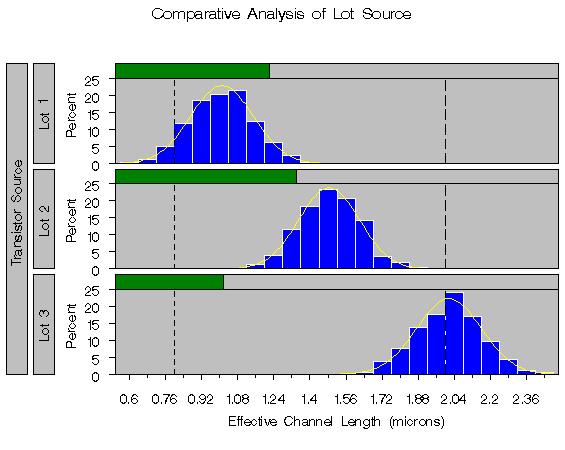
In Figure 3.2, it appears that
each lot produces transistors with channel lengths that
are normally distributed. The following statements use
the NORMAL option to fit a normal distribution to the data
for each lot (the observations corresponding to a specific level
of the classification variable are referred to as a cell).
The normal parameters ![]() and
and ![]() are estimated from the data for each lot,
and the curves are superimposed on each component histogram.
are estimated from the data for each lot,
and the curves are superimposed on each component histogram.
   proc capability data=channel noprint;
      specs lsl = 0.8  clsl = black  llsl = 2
            usl = 2.0  cusl = black  lusl = 3 ;
      comphist length / class      = lot
                        nrows      = 3
                        intertile  = 1
                        cprop      = green
                        normal(color = yellow)
                        cframe     = ligr
                        cfill      = blue
                        cframeside = ligr;
      label lot = 'Transistor Source';
   run;
The comparative histogram is displayed in Figure 3.3.
|
Specifying INTERTILE=1 inserts a space of one percent screen unit between the framed areas, which are referred to as tiles. The shaded bars, added with the CPROP= option, represent the relative frequency of observations in each cell. See "Dictionary of Options" for details concerning these options.
|
Chapter Contents |
Previous |
Next |
Top |
Copyright © 1999 by SAS Institute Inc., Cary, NC, USA. All rights reserved.