Chapter Contents
Previous
Next
|
Chapter Contents |
Previous |
Next |
| COMPHISTOGRAM Statement |
| See CAPCMH2 in the SAS/QC Sample Library |
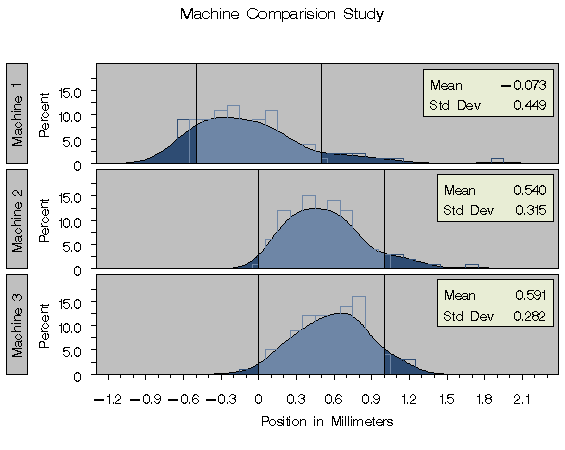
Three similar machines are used to attach a part to an assembly. One hundred assemblies are sampled from the output of each machine, and a part position is measured in millimeters. The following statements save the measurements in a SAS data set named MACHINES:
   data machines;
      input position @@;
      label position='Position in Millimeters';
      if      (_n_ <= 100) then machine = 'Machine 1';
      else if (_n_ <= 200) then machine = 'Machine 2';
      else                      machine = 'Machine 3';
      datalines;
   -0.17  -0.19  -0.24  -0.24  -0.12
    0.07  -0.61   0.22   1.91  -0.08
   -0.59   0.05  -0.38   0.82  -0.14
    0.32   0.12  -0.02   0.26   0.19
   -0.07   0.13  -0.49   0.07   0.65
    0.94  -0.51  -0.61  -0.57  -0.51
     .      .      .      .      .
     .      .      .      .      .
     .      .      .      .      .
    0.58   0.46   0.58   0.92   0.70
    0.81   0.07   0.33   0.82   0.62
    0.48   0.41   0.78   0.58   0.43
    0.07   0.27   0.49   0.79   0.92
    0.79   0.66   0.22   0.71   0.53
    0.57   0.90   0.48   1.17   1.03
    ;
Distinct specification limits for the three
machines are provided in a data set named SPECLIMS.
   data speclims;
      input @1 machine $9. _lsl_ _usl_;
      _var_ = 'position';
      datalines;
   Machine 1 -0.5 0.5
   Machine 2  0.0 1.0
   Machine 3  0.0 1.0
   ;
The following statements create a comparative histogram for
the measurements in MACHINES that displays the specification limits
in SPECLIMS. The display is shown in Output 3.1.1.
   title 'Machine Comparision Study';
   proc capability data=machines noprint;
      spec clsl=black cusl=black cleft=stgb cright=stgb;
      comphist position / class      = machine
                          nrows      = 3
                          intertile  = 1
                          midpoints  = -1.2 to 2.2 by 0.1
                          kernel (color=black fill)
                          cfill      = ligb
                          cframe     = ligr
                          cframeside = ligr
                          classspecs = speclims;
      inset mean std="Std Dev" / pos = ne  format = 6.3;
   run;
Output 3.1.1: Comparative Histograms

|
|
Chapter Contents |
Previous |
Next |
Top |
Copyright © 1999 by SAS Institute Inc., Cary, NC, USA. All rights reserved.