Chapter Contents
Previous
Next
|
Chapter Contents |
Previous |
Next |
| BOXCHART Statement |
| See SHWBOX7 in the SAS/QC Sample Library |
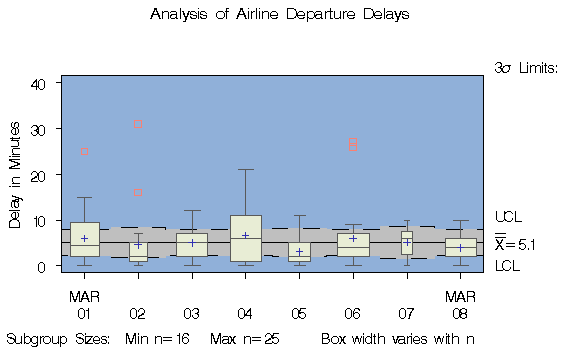
This example
shows how to create a box chart with box-and-whisker
plots whose widths vary proportionately with the subgroup
sample size.
The following statements create a SAS data set named TIMES2 that
contains flight departure delays (in minutes) recorded
daily for eight consecutive days:
   data times2;
      label delay = 'Delay in Minutes';
      informat day date7. ;
      format   day date7. ;
      input day @ ;
      do flight=1 to 25;
         input delay @ ;
         output;
         end;
   datalines;
   01MAR90  12   4   2   2  15   8   0  11   0   0   0  12   3
             .   2   3   5   0   6  25   7   4   9   5  10
   02MAR90   1   .   3   .   0   1   5   0   .   .   1   5   7
             .   7   2   2  16   2   1   3   1  31   .   0
   03MAR90   6   8   4   2   3   2   7   6  11   3   2   7   0
             1  10   2   5  12   8   6   2   7   2   4   5
   04MAR90  12   6   9   0  15   7   1   1   0   2   5   6   5
            14   7  21   8   1  14   3  11   0   1  11   7
   05MAR90   2   1   0   4   .   6   2   2   1   4   1  11   .
             1   0   .   5   5   .   2   3   6   6   4   0
   06MAR90   8   6   5   2   9   7   4   2   5   1   2   2   4
             2   5   1   3   9   7   8   1   0   4  26  27
   07MAR90   9   6   6   2   7   8   .   .  10   8   0   2   4
             3   .   .   .   7   .   6   4   0   .   .   .
   08MAR90   1   6   6   2   8   8   5   3   5   0   8   2   4
             2   5   1   6   4   5  10   2   0   4   1   1
   ;
   title 'Analysis of Airline Departure Delays';
   symbol v=plus c=bib;
   proc shewhart data=times2;
      boxchart delay * day /
         stddeviations
         nohlabel
         boxstyle      = schematic
         boxwidthscale = 1
         cframe        = vligb
         cboxes        = dagr
         cinfill       = ligr
         cboxfill      = ywh
         idcolor       = salmon;
   run;
The BOXWIDTHSCALE=1 option specifies that the widths of the box-and-whisker plots are to vary proportionately to the subgroup sample size n. This option is useful in situations where the sample size varies widely across subgroups. For further details, see the entry for the BOXWIDTHSCALE= option in Chapter 46, "Dictionary of Options."
Output 32.4.1: Box Chart with Box-and-Whisker Plots of Varying Widths
|
|
Chapter Contents |
Previous |
Next |
Top |
Copyright © 1999 by SAS Institute Inc., Cary, NC, USA. All rights reserved.