Chapter Contents
Previous
Next
|
Chapter Contents |
Previous |
Next |
| IRCHART Statement |
| See SHWIR1 in the SAS/QC Sample Library |
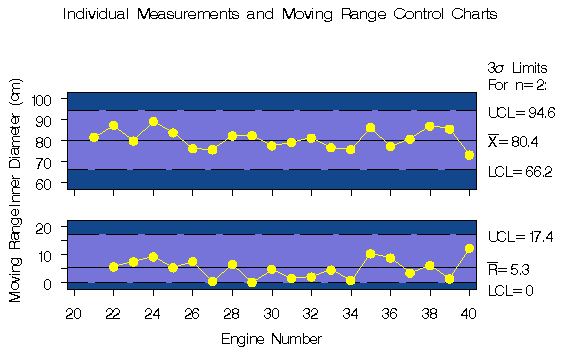
In the previous example, the OUTLIMITS= data set JETLIM saved control limits computed from the measurements in JETS. This example shows how these limits can be applied to data for an additional 20 jet engines provided in the following data set:
   data jets2;
      input engine diam @@;
      label diam   = "Inner Diameter (cm)"
            engine = "Engine Number";
   datalines;
   21 81.8  22 87.5  23 80.0  24 89.3  25 83.9
   26 76.3  27 75.8  28 82.4  29 82.6  30 77.7
   31 79.3  32 81.4  33 76.8  34 75.9  35 86.3
   36 77.4  37 80.9  38 87.1  39 85.7  40 73.3
   ;
The following statements create individual measurements and
moving range charts for the data in JETS2 using the control
limits in JETLIM:
   title 'Individual Measurements and Moving Range Control Charts';
   symbol v=dot c=yellow;
   proc shewhart data=jets2 limits=jetlim;
      irchart diam*engine / cframe   = vigb
                            cconnect = yellow
                            coutfill = red
                            cinfill  = vlib;
  run;
The charts are shown in Figure 34.7.
The LIMITS= option in the PROC SHEWHART statement specifies the
data set containing the control limits.
By default,*
this information is read from the first
observation in the LIMITS=
data set for which
The charts indicate that the process is in control, since all the individual measurements and moving ranges lie within their respective control limits.
In this example, the LIMITS= data set was created in a previous run of the SHEWHART procedure. You can also create a LIMITS= data set with the DATA step. See "LIMITS= Data Set" for details concerning the variables that you must provide.
|
|
Chapter Contents |
Previous |
Next |
Top |
Copyright © 1999 by SAS Institute Inc., Cary, NC, USA. All rights reserved.