Chapter Contents
Previous
Next
|
Chapter Contents |
Previous |
Next |
| NPCHART Statement |
| See SHWNP5 in the SAS/QC Sample Library |
This example shows how to use the DATA step to create LIMITS= data sets for use with the NPCHART statement. The variables _VAR_ and _SUBGRP_ are required. These variables must be character variables of length 8, and their values must match the process and subgroup-variable specified in the NPCHART statement. In addition, you must provide one of the following:
The following DATA step creates a data set named CLIMITS1, which provides a complete set of control limits for an np chart:
   data climits1;
      length _var_ _subgrp_ _type_ $8;
      _var_    = 'fail';
      _subgrp_ = 'batch';
      _limitn_ = 500;
      _type_   = 'STANDARD';
      _lclnp_  =  0;
      _np_     = 10;
      _uclnp_  = 20;
   run;
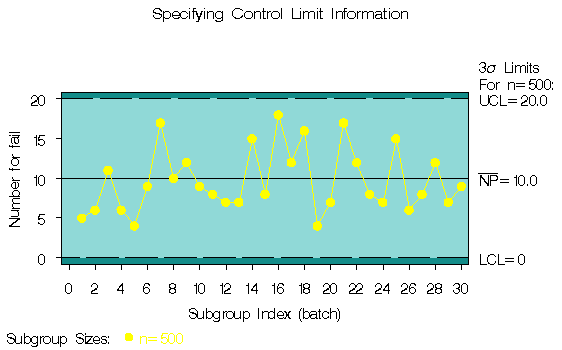
The following statements read the control limits*
from the data set CLIMITS1 and apply them to the count data
in the data set CIRCUITS, which is introduced
at "Creating np Charts from Count Data" :
   title 'Specifying Control Limit Information';
   symbol v=dot c=yellow;
   proc shewhart data=circuits limits=climits1;
      npchart fail*batch / subgroupn = 500
                           cframe    = vibg
                           cconnect  = yellow
                           coutfill  = salmon
                           cinfill   = vlibg;
   run;

|
   data climits2;
      length _var_ _subgrp_ _type_ $8;
      _var_    = 'fail';
      _subgrp_ = 'batch';
      _limitn_ = 500;
      _type_   = 'STANDARD';
      _p_      = .02;
   run;
   proc shewhart data=circuits limits=climits2;
      npchart fail*batch / subgroupn = 500
                           cframe    = vibg
                           cinfill   = vlibg
                           cconnect  = yellow
                           coutfill  = salmon;
   run;
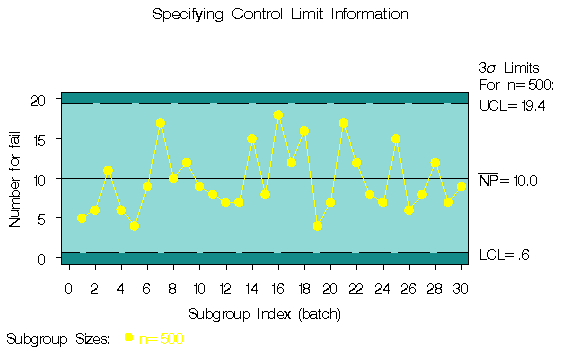
The chart is shown in Output 37.4.2. Note that the control limits are not the same as those shown in Output 37.4.1.
Output 37.4.2: Control Limit Information Read from CLIMITS2

|
|
Chapter Contents |
Previous |
Next |
Top |
Copyright © 1999 by SAS Institute Inc., Cary, NC, USA. All rights reserved.