Chapter Contents
Previous
Next
|
Chapter Contents |
Previous |
Next |
| PCHART Statement |
| See SHWPOC in the SAS/QC Sample Library |
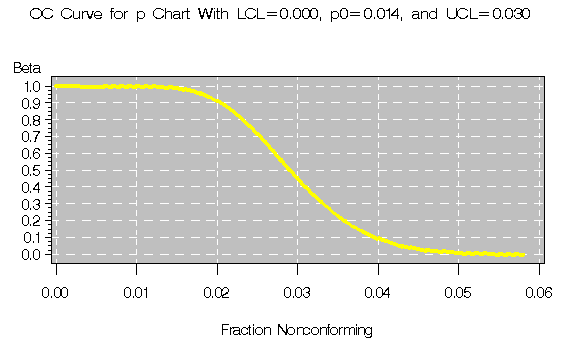
This example uses the GPLOT procedure and the OUTLIMITS= data set FAILLIM2 from the previous example to plot an OC curve for the p chart shown in Output 38.4.3.
The OC curve displays ![]() (the probability that pi
lies within the control limits) as a function of p
(the true proportion nonconforming).
The computations are exact, assuming that the process is in
control and that the number of nonconforming items (Xi)
has a binomial distribution.
(the probability that pi
lies within the control limits) as a function of p
(the true proportion nonconforming).
The computations are exact, assuming that the process is in
control and that the number of nonconforming items (Xi)
has a binomial distribution.
The value of ![]() is computed as follows:
is computed as follows:

   data ocpchart;
      set faillim2;
      keep beta fraction;
      nucl=_limitn_*_uclp_;
      nlcl=_limitn_*_lclp_;
      do p=0 to 500;
         fraction=p/1000;
         if nucl=floor(nucl) then
            adjust=probbnml(fraction,_limitn_,nucl) -
                   probbnml(fraction,_limitn_,nucl-1);
         else adjust=0;
         if nlcl=0 then
            beta=1 - probbeta(fraction,nucl,_limitn_-nucl+1) + adjust;
         else beta=probbeta(fraction,nlcl,_limitn_-nlcl+1) -
                   probbeta(fraction,nucl,_limitn_-nucl+1) +
                   adjust;
         if beta >= 0.001 then output;
         end;
      call symput('lcl', put(_lclp_,5.3));
      call symput('mean',put(_p_,   5.3));
      call symput('ucl', put(_uclp_,5.3));
   run;
The following statements display the OC curve shown in Output 38.5.1:
   title "OC Curve for p Chart With LCL=&LCL, p0=&MEAN, and UCL=&UCL";
   symbol i=j w=2 v=none c=yellow;
   proc gplot data=ocpchart;
      plot beta*fraction /
         vaxis=axis1
         haxis=axis2
         frame
         autovref
         autohref
         lvref = 2
         lHREF=2
         vzero
         hzero
         cframe = ligr
         cHREF=cxfefefe
         cvref  = cxfefefe;
      label fraction = 'Fraction Nonconforming'
            beta     = 'Beta';
   run;
Output 38.5.1: OC Curve for p Chart
|
|
Chapter Contents |
Previous |
Next |
Top |
Copyright © 1999 by SAS Institute Inc., Cary, NC, USA. All rights reserved.