Chapter Contents
Previous
Next
|
Chapter Contents |
Previous |
Next |
| PCHART Statement |
| See SHWPCHR in the SAS/QC Sample Library |
In the previous example, the OUTLIMITS= data set CIRLIM saved control limits computed from the data in CIRCUITS. This example shows how these limits can be applied to new data provided in the following data set:
   data circuit2;
      input batch fail @@;
   datalines;
   31  12   32   9   33  16    34   9
   35   3   36   8   37  20    38   4
   39   8   40   6   41  12    42  16
   43   9   44   2   45  10    46   8
   47  14   48  10   49  11    50   9
   ;
The following statements create a p chart for the data in CIRCUIT2 using the control limits in CIRLIM:
   title 'p Chart for the Proportion of Failing Circuits';
   symbol v=dot c=salmon;
   proc shewhart data=circuit2 limits=cirlim;
      pchart fail*batch / subgroupn = 500
                          cframe    = lib
                          cinfill   = bwh
                          coutfill  = yellow
                          cconnect  = salmon;
   run;
The LIMITS= option in the PROC SHEWHART statement specifies the data set containing the control limits. By default,* this information is read from the first observation in the LIMITS= data set for which
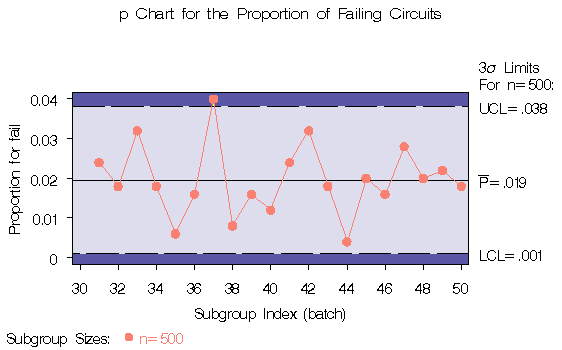
The resulting p chart is shown in Figure 38.9.
|
The proportion of nonconforming items in the 37 th batch exceeds the upper control limit, signaling that the process is out of control.
In this example, the LIMITS= data set was created in a previous run of the SHEWHART procedure. You can also create a LIMITS= data set with the DATA step. See "LIMITS= Data Set" for details concerning the variables that you must provide.
|
Chapter Contents |
Previous |
Next |
Top |
Copyright © 1999 by SAS Institute Inc., Cary, NC, USA. All rights reserved.