Chapter Contents
Previous
Next
|
Chapter Contents |
Previous |
Next |
| RCHART Statement |
| See SHWRCHR in the SAS/QC Sample Library |
In the previous example,
the OUTLIMITS= data set DISKLIM
saved control limits computed from the measurements in DISKS.
This example shows how these limits can be applied to new
data provided in the following data set:
   data disks2;
      input lot @;
      do i=1 to 6;
         input time @;
         output;
         end;
      drop i;
   datalines;
   26 7.93 7.97 7.89 7.81 7.88 7.92
   27 7.86 7.91 7.87 7.89 7.83 7.87
   28 7.93 7.95 7.90 7.89 7.88 7.90
   29 7.97 8.00 7.86 7.89 7.84 7.78
   30 7.91 7.93 7.98 7.93 7.83 7.88
   31 7.85 7.94 7.88 7.98 7.96 7.84
   32 7.86 8.01 7.88 7.95 7.90 7.89
   33 7.87 7.93 7.96 7.89 7.81 8.00
   34 7.87 7.97 7.95 7.89 7.92 7.84
   35 7.92 7.97 7.90 7.88 7.89 7.86
   36 7.96 7.90 7.90 7.84 7.90 8.00
   37 7.92 7.90 7.98 7.92 7.94 7.94
   38 7.88 7.99 8.02 7.98 7.88 7.92
   39 7.89 7.91 7.92 7.90 7.94 7.94
   40 7.84 7.88 7.91 7.98 7.87 7.93
   41 7.91 7.87 7.96 7.91 7.89 7.92
   42 7.96 7.93 7.86 7.93 7.86 7.94
   43 7.84 7.82 7.87 7.91 7.91 8.01
   44 7.93 7.91 7.92 7.88 7.91 7.86
   45 7.95 7.92 7.93 7.90 7.86 8.00
   ;
The following statements create an R chart using the control limits in DISKLIM:
   title 'Range Chart for Disk Drive Test Times';
   symbol v=dot c=rose;
   proc shewhart table=disks2 limits=disklim;
      rchart time*lot / cframe   = vipb
                        cinfill  = ywh
                        cconnect = rose;
   run;
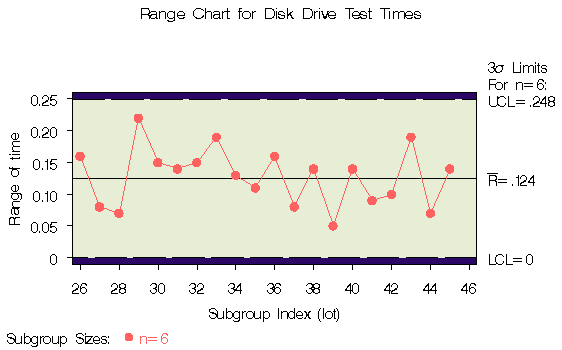
The chart is shown in Figure 39.8.
The LIMITS= option in the PROC SHEWHART statement specifies the
data set containing the control limits.
By default,*
this information is read from the first
observation in the LIMITS=
data set for which
|
All the ranges lie within the control limits, indicating that the variability in disk drive performance is still in statistical control.
In this example, the LIMITS= data set was created in a previous run of the SHEWHART procedure. You can also create a LIMITS= data set with the DATA step. See Example 39.2 and "LIMITS= Data Set" for details concerning the variables that you must provide.
|
Chapter Contents |
Previous |
Next |
Top |
Copyright © 1999 by SAS Institute Inc., Cary, NC, USA. All rights reserved.