Chapter Contents
Previous
Next
|
Chapter Contents |
Previous |
Next |
| XRCHART Statement |
| See SHWXR3 in the SAS/QC Sample Library |
By default,
the XRCHART statement estimates the process mean (![]() ) and standard deviation (
) and standard deviation (![]() )from the data, as in the previous example. However,
there are applications in which standard values
(
)from the data, as in the previous example. However,
there are applications in which standard values
(![]() and
and ![]() ) are available
based, for instance, on previous experience or
extensive sampling. You can specify these values with the MU0=
and SIGMA0= options.
For example, suppose it is known that the adhesive coating
process introduced in the previous example has a mean of
1260 and standard deviation of 15. The following
statements specify these standard values:
) are available
based, for instance, on previous experience or
extensive sampling. You can specify these values with the MU0=
and SIGMA0= options.
For example, suppose it is known that the adhesive coating
process introduced in the previous example has a mean of
1260 and standard deviation of 15. The following
statements specify these standard values:
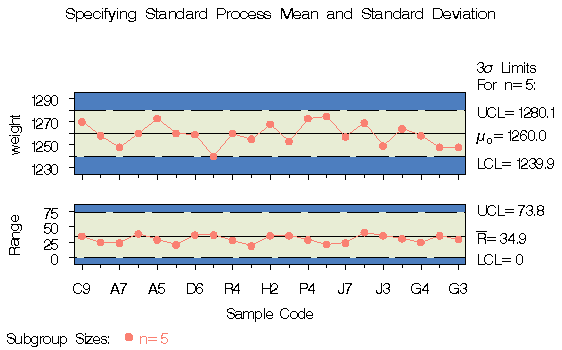
   title 'Specifying Standard Process Mean and Standard Deviation';
   symbol v=dot c=salmon;
   proc shewhart history=tape;
      xrchart weight*sample / mu0      = 1260
                              sigma0   = 15
                              xsymbol  = mu0
                              cframe   = bigb
                              cinfill  = ywh
                              cconnect = salmon;
   run;
The XSYMBOL= option specifies the label for the central line on
the ![]() chart.
The resulting
chart.
The resulting ![]() and R charts are shown in Output 43.2.1.
and R charts are shown in Output 43.2.1.
|
You can also specify ![]() and
and ![]() with the
variables _MEAN_ and _STDDEV_ in a LIMITS= data set,
as illustrated by the following statements:
with the
variables _MEAN_ and _STDDEV_ in a LIMITS= data set,
as illustrated by the following statements:
   data tapelim;
      length _var_ _subgrp_ _type_ $8;
      _var_    = 'weight';
      _subgrp_ = 'sample';
      _type_   = 'STANDARD';
      _limitn_ = 5;
      _mean_   = 1260;
      _stddev_ = 15;

   proc shewhart history=tape limits=tapelim;
      xrchart weight*sample / xsymbol=mu0;
   run;
The variables _VAR_ and _SUBGRP_ are required, and their values must match the process and subgroup-variable, respectively, specified in the XRCHART statement. The bookkeeping variable _TYPE_ is not required, but it is recommended to indicate that the variables _MEAN_ and _STDDEV_ provide standard values rather than estimated values.
The resulting charts (not shown here) are identical to those shown in Output 43.2.1.
|
Chapter Contents |
Previous |
Next |
Top |
Copyright © 1999 by SAS Institute Inc., Cary, NC, USA. All rights reserved.