Book Contents
Previous
Next
|
Book Contents |
Previous |
Next |
| SAS/OR: The QSIM Application |
|
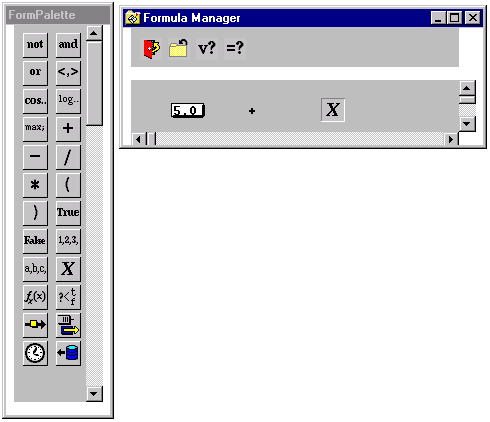
Formulas are built using an interface that is similar to that used when building models. The palette has a set of icons that can be dragged and dropped into the Formula Manager window. You use these to build expressions. The following table shows some of the elements that are used to build expressions:
| Icon | Description |
| another formula | |
| a transaction attribute | |
| the simulation clock | |
| a component in the model | |
| an observation of a variable in a SAS data set | |
| a number constant | |
| a string constant |
As with components, each of these elements has a pop-up menu associated with it.
For example, the random variable icon
![]() shown in Figure 6.6
has a pop-up menu, shown in Figure 4.2.
shown in Figure 6.6
has a pop-up menu, shown in Figure 4.2.
|
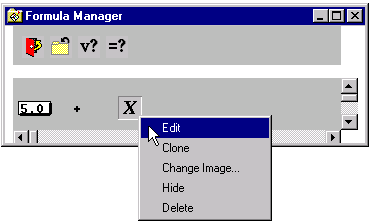
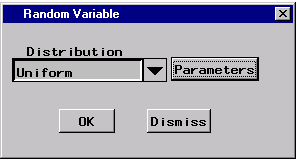
If you select Edit, the window shown in Figure 4.3 is displayed. From this window you select the distribution for the random variable. When the formula is evaluated (to set an attribute or determine transaction routing, for example), an observation of the random variable is made.
|
Another important formula element is the model element,
![]() .
Recall the example discussed in the "Switch Component" .
There, the model in Figure 2.11
routes transactions to the shortest queue.
The control panel on the Switch shown
in Figure 2.10 has TRUE as a case
for routing to component Queue 1.
This means that you want the formula associated with this
switch to return TRUE if Queue 1 is shorter than Queue 2.
To accomplish this, you compare the sizes of the
two queues and return TRUE if the size of Queue 1 is less
than the size of Queue 2.
.
Recall the example discussed in the "Switch Component" .
There, the model in Figure 2.11
routes transactions to the shortest queue.
The control panel on the Switch shown
in Figure 2.10 has TRUE as a case
for routing to component Queue 1.
This means that you want the formula associated with this
switch to return TRUE if Queue 1 is shorter than Queue 2.
To accomplish this, you compare the sizes of the
two queues and return TRUE if the size of Queue 1 is less
than the size of Queue 2.
|
|
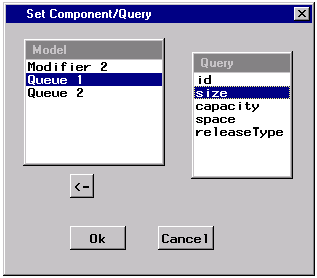
Figure 4.4 shows the formula for accomplishing this. The edit window for the left-hand model element is shown in Figure 4.5.
|
The Model list box contains the simulation components. When you select one of these components the Query list box displays query messages for that component. When the formula is evaluated, the result of the query of the identified component will be used. For example, when the formula shown in Figure 4.4 is evaluated, the model element will query Queue 1 with the message size, which will return the number of elements in its queue. Similarly, if you edit the model element on the right-hand side of the > and set it to query size of Queue 2, the formula will evaluate to TRUE if Queue 1 has fewer elements than Queue 2. In this case, the switch will send the transaction to Queue 1.
You should be careful when validating your models that they are behaving as you want them. There is not a great amount of error-checking done when formulas are evaluated, particularly with regard to type, but every error will not be detected. For example, a Router may expect a TRUE or FALSE returned from a formula, but you could enter a valid formula that evaluates to a number or a string. The QSIM Application would not detect this type of error but would function as if a nonzero number were TRUE.
The formula syntax is standard with two exceptions. First, functions of one argument, such as the trigonometric functions, are specified in reverse polish style. Thus, an expression like log(X) would be displayed as in in Figure 4.6.

|
Functions of two arguments, such as max and min, are specified
between the arguments.
So, an expression like ![]() would be displayed as
in Figure 4.7.
would be displayed as
in Figure 4.7.
|
|
|
Book Contents |
Previous |
Next |
Top |