Chapter Contents
Previous
Next
|
Chapter Contents |
Previous |
Next |
| Introduction to Structural Equations with Latent Variables |
Complicated models are often easier to understand when they are expressed as path diagrams. One advantage of path diagrams over equations is that variances and covariances can be shown directly in the path diagram. Loehlin (1987) provides a detailed discussion of path diagrams.
It is customary to write the names of manifest variables in rectangles and names of latent variables in ovals. The coefficients in each equation are indicated by drawing arrows from the independent variables to the dependent variable. Covariances between exogenous variables are drawn as two-headed arrows. The variance of an exogenous variable can be displayed as a two-headed arrow with both heads pointing to the exogenous variable, since the variance of a variable is the covariance of the variable with itself. Here is a path diagram for the spleen data, explicitly showing all latent variables and variances of exogenous variables.

|
There is an easier way to draw the path diagram based on McArdle's reticular action model (RAM) (McArdle and McDonald 1984). McArdle uses the convention that a two-headed arrow that points to an endogenous variable actually refers to the error or disturbance term associated with that variable. A two-headed arrow with both heads pointing to the same endogenous variable represents the error or disturbance variance for the equation that determines the endogenous variable; there is no need to draw a separate oval for the error or disturbance term. Similarly, a two-headed arrow connecting two endogenous variables represents the covariance between the error of disturbance terms associated with the endogenous variables. The RAM conventions allow the previous path diagram to be simplified, as follows.
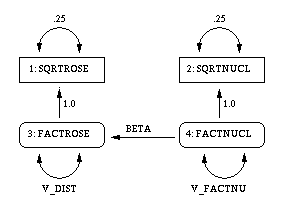
|
The RAM statement in PROC CALIS provides a simple way to transcribe a path diagram based on the reticular action model. Assign the integers 1, 2, 3,... to the variables in the order in which they appear in the SAS data set or in the VAR statement, if you use one. Assign subsequent consecutive integers to the latent variables displayed explicitly in the path diagram (excluding the error and disturbance terms implied by two-headed arrows) in any order. Each arrow in the path diagram can then be identified by two numbers indicating the variables connected by the path. The RAM statement consists of a list of descriptions of all the arrows in the path diagram. The descriptions are separated by commas. Each arrow description consists of three or four numbers and, optionally, a name in the following order:
The model for the spleen data can be specified with the RAM statement, as follows:
       /* 1 sqrtrose  */
       /* 2 sqrtnucl  */
       /* 3 factrose  */
       /* 4 factnucl  */
   proc calis data=spleen cov stderr method=ml outram=splram1;
      var sqrtrose sqrtnucl;
      ram 1 1 3 1,         /* sqrtrose <- factrose */
          1 2 4 1,         /* sqrtnucl <- factnucl */
          1 3 4 beta,      /* factrose <- factnucl */
          2 1 1 .25,       /* error variance for sqrtrose */
          2 2 2 .25,       /* error variance for sqrtnucl */
          2 3 3 v_dist,  /* disturbance variance for factrose */
          2 4 4 v_factnu;    /* variance of factnucl */
   run;
The resulting output in RAM form is displayed in Figure 14.7.
You can request an output data set containing the model specification by using the OUTRAM= option in the PROC CALIS statement. Names for the latent variables can be specified in a VNAMES statement.
   proc calis data=spleen cov stderr method=ml outram=splram1;
      var sqrtrose sqrtnucl;
      vnames 1 factrose factnucl,
             2 err_rose err_nucl disturb factnucl;
      ram 1 1 3 1,         /* sqrtrose <- factrose */
          1 2 4 1,         /* sqrtnucl <- factnucl */
          1 3 4 beta,      /* factrose <- factnucl */
          2 1 1 .25,       /* error variance for sqrtrose */


          2 2 2 .25,       /* error variance for sqrtnucl */
          2 3 3 v_dist,    /* disturbance variance for factrose */
          2 4 4 v_factnu;  /* variance of factnucl */
   run;

   proc print;
   run;
The RAM output is displayed in Figure 14.8.
|
| ||||||||||||||||||||||||||||||||||||||||||||||||||||||||||||||||||||||||||||||||||||||||||||
The OUTRAM= data set contains the RAM model as you specified it in the RAM statement, but it contains the final parameter estimates and standard errors instead of the initial values.
|
|
This data set can be used as input to another run of PROC CALIS with the INRAM= option in the PROC CALIS statement. For example, if the iteration limit is exceeded, you can use the RAM data set to start a new run that begins with the final estimates from the last run. Or you can change the data set to add or remove constraints or modify the model in various other ways. The easiest way to change a RAM data set is to use the FSEDIT procedure, but you can also use a DATA step. For example, you could set the variance of the disturbance term to zero, effectively removing the disturbance from the equation, by removing the parameter name v_dist in the _NAME_ variable and setting the value of the estimate to zero in the _ESTIM_ variable:
   data splram2(type=ram);
      set splram1;
      if _name_='v_dist' then
         do;
            _name_=' ';
            _estim_=0;
         end;
   run;

   proc calis data=spleen inram=splram2 cov stderr;
   run;
The resulting RAM output is displayed in Figure 14.10.
|
| ||||||||||||||||||||||||||||||||||||||||||||||||||||||||||||||||||||||||||||||||||||||||||||
|
Chapter Contents |
Previous |
Next |
Top |
Copyright © 1999 by SAS Institute Inc., Cary, NC, USA. All rights reserved.