Chapter Contents
Previous
Next
|
Chapter Contents |
Previous |
Next |
| Using the Output Delivery System |
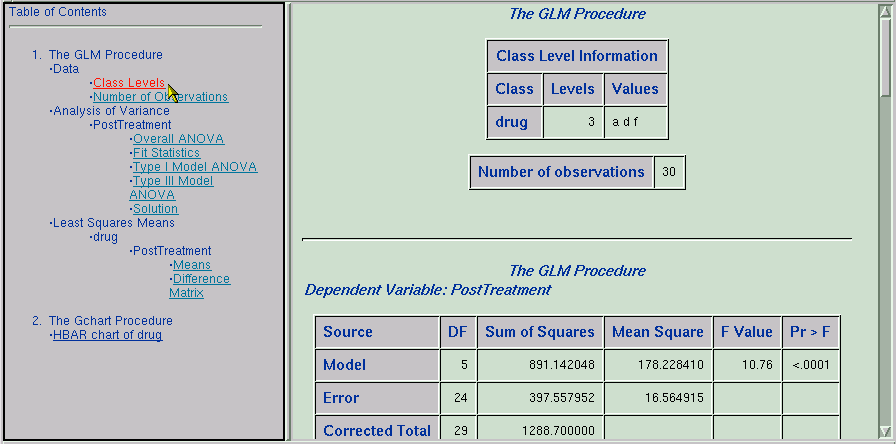
The data in the following example are selected from a larger experiment on the use of drugs in the treatment of leprosy (Snedecor and Cochran 1967, p. 422).
Variables in the study are
| Drug | - two antibiotics (A and D) and a control (F) |
| PreTreatment | - a pretreatment score of leprosy bacilli |
| PostTreatment | - a posttreatment score of leprosy bacilli |
The data set is created as follows:
   data drugtest;
      input drug $ PreTreatment PostTreatment @@;
      datalines;
   a 11  6  a  8  0  a  5  2  a 14  8  a 19 11
   a  6  4  a 10 13  a  6  1  a 11  8  a  3  0
   d  6  0  d  6  2  d  7  3  d  8  1  d 18 18
   d  8  4  d 19 14  d  8  9  d  5  1  d 15  9
   f 16 13  f 13 10  f 11 18  f  9  5  f 21 23
   f 16 12  f 12  5  f 12 16  f  7  1  f 12 20
   ;
The ODS HTML statement opens the HTML destination, specifies the body file name, requests that a table of contents be generated for the output, and specifies the file name of the frame to contain the body and table of contents. The NOGTITLE option in the ODS HTML statement specifies that titles are not to be included as an integral part of any generated graphics. For all graphics contained in the specified body file, titles appear in the body file and are external to graphics.
   ods html body='glmb.htm'
            contents='glmc.htm'
            frame='glmf.htm'
            nogtitle;

   ods output LSMeans=lsmeans;
The ODS OUTPUT statement writes the table of LS-means to the data set called lsmeans.
The GLM procedure is invoked to perform an analysis of covariance and compute LS-means for the variable Drug.
   proc glm;
      class drug;
      model PostTreatment = Drug|PreTreatment / solution;
      lsmeans drug / stderr pdiff;
   quit;
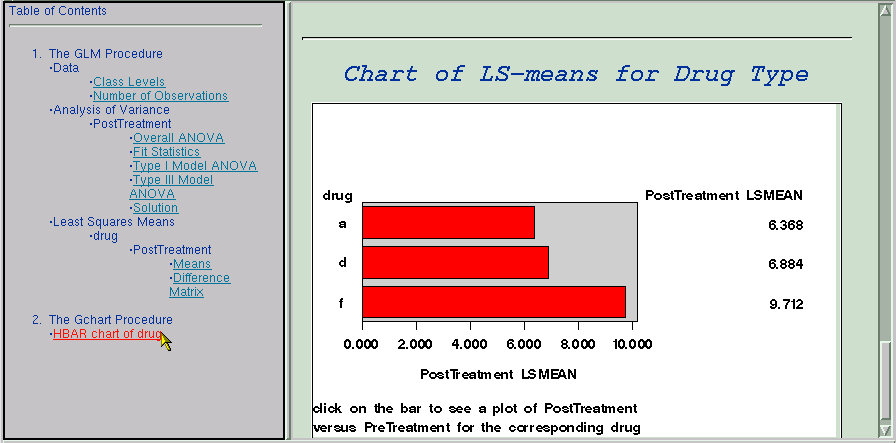
The following steps demonstrate how you can create links to connect the results of different analyses. In this example, the table of LS-means is graphically summarized with the GCHART procedure. In the steps that follow, each part of the resulting chart is linked to a plot that displays the relationship between the PostTreatment response variable and the PreTreatment variable.
The following DATA step creates a new variable called drugclick that matches each drug value with an HTML file. The variable drugclick is used in the subsequent GCHART procedure run. The variable provides the connection information for linking the two parts of the analysis together. The files referred to in these statements are created in a later step.
   data lsmeans;
      set lsmeans;
      if Drug='a' then drugclick='HREF=drug1.htm';
      if Drug='d' then drugclick='HREF=drug2.htm';
      if Drug='f' then drugclick='HREF=drug3.htm';
   run;
The following GOPTIONS and AXIS statements specify settings for the GCHART procedure. PROC GCHART is invoked, and the HBAR statement requests a horizontal bar chart for the variable drug. The length of the bars represent the value of the lsmean variable. The HTML option specifies the variable drugclick as the html linking variable to use. The FOOTNOTE1 and FOOTNOTE2 statements provide text that indicates how to use the links on the graph.
   goptions ftext=swissb hsize=5.5in vsize=3.5in
            border cback=white;
   axis1 minor=none label=(angle=90 rotate=0);
   axis2 minor=none;

   title f=swiss 'Chart of LS-means for Drug Type';
   proc gchart data=lsmeans;
      hbar Drug/sumvar=lsmean type=mean
                frame cframe=ligr
                gaxis=axis1 raxis=axis2
                html=drugclick;
   footnote1 j=l 'click on the bar to see a plot of PostTreatment';
   footnote2 j=l 'versus PreTreatment for the corresponding drug';
   format lsmean 6.3;
   run;

   footnote;
   ods html close;
   run;
The preceding statements create a chart that summarizes the information from PROC GLM and that contains links to a second graphic analysis (using the variable drugclick and the HTML option in PROC GCHART).
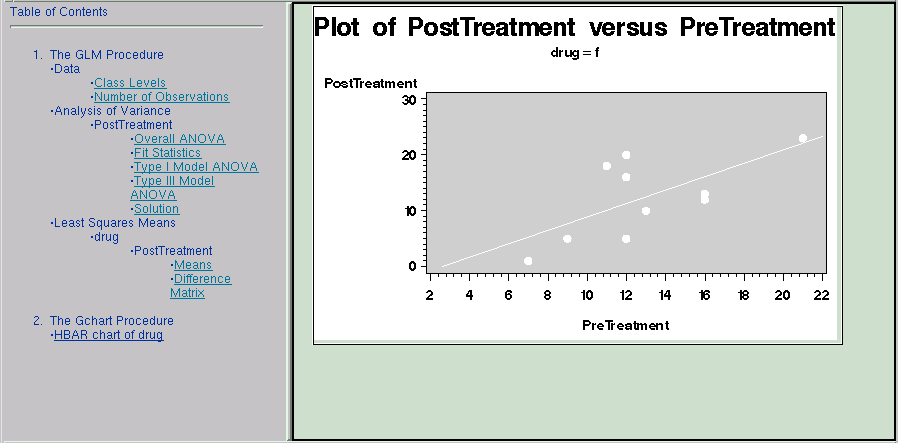
The following statements provide that second analysis. The three files referred to by the drugclick variable are created as follows:
   ods html body='drug1.htm' newfile=page;
   symbol1 c=white v=dot i=r ;
   title 'Plot of PostTreatment versus PreTreatment';
   proc gplot data=drugtest uniform;
      plot PostTreatment*PreTreatment/frame cframe=ligr;
   by Drug notsorted;
   footnote;
   run;
   ods html close;
The NEWFILE option in the ODS HTML statement specifies that a new HTML file be created for each page of output. Note that page breaks occur only when a procedure explicitly starts a new page. The NEWFILE option also increments the filename for each new HTML file created, with the first filename corresponding to that given in the BODY= option, 'drug1.htm'.
The GPLOT procedure is invoked, producing a plot of the variable PostTreatment versus the variable PreTreatment for each value of the Drug variable. Thus, three plots are created, and each plot is contained in a separate html file. The files are named 'drug1.htm', 'drug2.htm', and 'drug3.htm'. The filenames match those filenames specified as values of the drugclick variable.
Output 15.12.1: Output from PROC GLM
|
|
|
|
Chapter Contents |
Previous |
Next |
Top |
Copyright © 1999 by SAS Institute Inc., Cary, NC, USA. All rights reserved.