Example 29.2: Normal Regression, Log Link
Consider the following data, where x is an
explanatory variable, and y is the response variable.
It appears that y varies nonlinearly with x and
that the variance is approximately constant.
A normal distribution with a log link function is chosen
to model these data; that is, 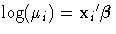 so that
 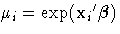 .
.
   data nor;
      input x y;
      datalines;
   0 5
   0 7
   0 9
   1 7
   1 10
   1 8
   2 11
   2 9
   3 16
   3 13
   3 14
   4 25
   4 24
   5 34
   5 32
   5 30
   ;
The following SAS statements produce the analysis
with the normal distribution and log link:
   proc genmod data=nor;
      model y = x / dist = normal
                    link = log
                    ;
      output out = Residuals
             pred = Pred
             resraw = Resraw
             reschi = Reschi
             resdev = Resdev
             stdreschi = Stdreschi
             stdresdev = Stdresdev
             reslik = Reslik;
      proc print data=Residuals;
   run;
The OUTPUT statement
is specified to produce a data set that contains predicted
values and residuals for each observation.
This data set can be useful for further
analysis, such as residual plotting.
The output from these statements is displayed in Output 29.2.1.
Output 29.2.1: Log Linked Normal Regression
|
| Model Information |
| Data Set |
WORK.NOR |
| Distribution |
Normal |
| Link Function |
Log |
| Dependent Variable |
y |
| Observations Used |
16 |
| Criteria For Assessing Goodness Of Fit |
| Criterion |
DF |
Value |
Value/DF |
| Deviance |
14 |
52.3000 |
3.7357 |
| Scaled Deviance |
14 |
16.0000 |
1.1429 |
| Pearson Chi-Square |
14 |
52.3000 |
3.7357 |
| Scaled Pearson X2 |
14 |
16.0000 |
1.1429 |
| Log Likelihood |
|
-32.1783 |
|
| Analysis Of Parameter Estimates |
| Parameter |
DF |
Estimate |
Standard Error |
Wald 95% Confidence Limits |
Chi-Square |
Pr > ChiSq |
| Intercept |
1 |
1.7214 |
0.0894 |
1.5461 |
1.8966 |
370.76 |
<.0001 |
| x |
1 |
0.3496 |
0.0206 |
0.3091 |
0.3901 |
286.64 |
<.0001 |
| Scale |
1 |
1.8080 |
0.3196 |
1.2786 |
2.5566 |
|
|
| NOTE: |
The scale parameter was estimated by maximum likelihood. |
|
|
The PROC GENMOD scale parameter, in the case of
the normal distribution, is the standard deviation.
By default, the scale parameter is estimated by
maximum likelihood. You can specify a fixed
standard deviation by using the NOSCALE and SCALE= options
in the MODEL statement.
Output 29.2.2: Data Set of Predicted Values and Residuals
|
| Obs |
x |
y |
Pred |
Reschi |
Resdev |
Resraw |
Stdreschi |
Stdresdev |
Reslik |
| 1 |
0 |
5 |
5.5921 |
-0.59212 |
-0.59212 |
-0.59212 |
-0.34036 |
-0.34036 |
-0.34036 |
| 2 |
0 |
7 |
5.5921 |
1.40788 |
1.40788 |
1.40788 |
0.80928 |
0.80928 |
0.80928 |
| 3 |
0 |
9 |
5.5921 |
3.40788 |
3.40788 |
3.40788 |
1.95892 |
1.95892 |
1.95892 |
| 4 |
1 |
7 |
7.9324 |
-0.93243 |
-0.93243 |
-0.93243 |
-0.54093 |
-0.54093 |
-0.54093 |
| 5 |
1 |
10 |
7.9324 |
2.06757 |
2.06757 |
2.06757 |
1.19947 |
1.19947 |
1.19947 |
| 6 |
1 |
8 |
7.9324 |
0.06757 |
0.06757 |
0.06757 |
0.03920 |
0.03920 |
0.03920 |
| 7 |
2 |
11 |
11.2522 |
-0.25217 |
-0.25217 |
-0.25217 |
-0.14686 |
-0.14686 |
-0.14686 |
| 8 |
2 |
9 |
11.2522 |
-2.25217 |
-2.25217 |
-2.25217 |
-1.31166 |
-1.31166 |
-1.31166 |
| 9 |
3 |
16 |
15.9612 |
0.03878 |
0.03878 |
0.03878 |
0.02249 |
0.02249 |
0.02249 |
| 10 |
3 |
13 |
15.9612 |
-2.96122 |
-2.96122 |
-2.96122 |
-1.71738 |
-1.71738 |
-1.71738 |
| 11 |
3 |
14 |
15.9612 |
-1.96122 |
-1.96122 |
-1.96122 |
-1.13743 |
-1.13743 |
-1.13743 |
| 12 |
4 |
25 |
22.6410 |
2.35897 |
2.35897 |
2.35897 |
1.37252 |
1.37252 |
1.37252 |
| 13 |
4 |
24 |
22.6410 |
1.35897 |
1.35897 |
1.35897 |
0.79069 |
0.79069 |
0.79069 |
| 14 |
5 |
34 |
32.1163 |
1.88366 |
1.88366 |
1.88366 |
1.22914 |
1.22914 |
1.22914 |
| 15 |
5 |
32 |
32.1163 |
-0.11634 |
-0.11634 |
-0.11634 |
-0.07592 |
-0.07592 |
-0.07592 |
| 16 |
5 |
30 |
32.1163 |
-2.11634 |
-2.11634 |
-2.11634 |
-1.38098 |
-1.38098 |
-1.38098 |
|
The data set of predicted values and residuals
(Output 29.2.2) is created by the OUTPUT statement.
With this data set, you can construct residual plots
using the GPLOT procedure to aid in assessing model fit.
Note that raw, Pearson, and deviance
residuals are equal in this example.
This is a characteristic of the normal distribution
and is not true in general for other distributions.
Copyright © 1999 by SAS Institute Inc., Cary, NC, USA. All rights reserved.