Computational Methods
The t Statistic
The form of the t statistic used varies with the
type of test being performed.
- To compare an individual mean with a
sample of size n to a value m, use

where  is the sample mean of the observations
and s2 is the sample variance of the observations.
is the sample mean of the observations
and s2 is the sample variance of the observations.
- To compare n paired differences to a value m, use

where  is the sample mean of the paired
differences and s2d is the sample variance
of the paired differences.
is the sample mean of the paired
differences and s2d is the sample variance
of the paired differences.
- To compare means from two independent samples with
n1 and n2 observations to a value m, use

where s2 is the pooled variance
-
s2 = [((n1-1)s12+(n2-1)s22)/(n1+n2-2)]
and s12 and s22 are the
sample variances of the two groups.
The use of this t statistic depends on the assumption that
 , where
  and
and  are the population variances of the two groups.
The folded form of the F statistic,
F', tests the hypothesis that the variances are
equal, where
-
F' = [(max(s12,s22))/(min(s12,s22))]
A test of F' is a two-tailed F test because
you do not specify which variance you expect to be larger.
The p-value gives
the probability of a greater F value under the
null hypothesis that .The Approximate t Statistic
Under the assumption of unequal variances, the approximate
t statistic is computed as

where
-
w1 = [(s12)/(n1)], w2 = [(s22)/(n2)]
The Cochran and Cox Approximation
The Cochran and Cox (1950) approximation of the probability level
of the approximate t statistic is the value of p such that
-
t' = [(w1t1+w2t2)/(w1+w2)]
where t1 and t2 are the critical values of the
t distribution corresponding to a significance level of
p and sample sizes of n1 and n2, respectively.
The number of degrees of freedom is undefined when  .In general, the Cochran and Cox test tends
to be conservative (Lee and Gurland 1975).
.In general, the Cochran and Cox test tends
to be conservative (Lee and Gurland 1975).
Satterthwaite's Approximation
The formula for Satterthwaite's (1946) approximation for the
degrees of freedom for the approximate t statistic is:
-
df = [( (w1+w2)2 )/( ( [(w12)/(n1-1)]+[(w22)/(n2-1)] ) )]
Refer to Steel and Torrie (1980) or Freund,
Littell, and Spector (1986) for more information.
The form of the confidence interval varies with the statistic
for which it is computed. In the following confidence intervals involving
means,  is the
 % quantile of the t distribution with
n-1 degrees of freedom.
The confidence interval for
% quantile of the t distribution with
n-1 degrees of freedom.
The confidence interval for
- an individual mean from a sample of size n compared
to a value m is given by

where is the sample mean of the observations
and s2 is the sample variance of the observations
- paired differences with a sample of size n differences
compared to a value m is given by

where and s2d are the sample mean and sample variance
of the paired differences, respectively
- the difference of two means from independent samples with
n1 and n2 observations compared to a value m is given by

where s2 is the pooled variance
-
s2 = [((n1-1)s12+(n2-1)s22)/(n1+n2-2)]
and where s12 and s22 are the
sample variances of the two groups.
The use of this confidence interval depends on the assumption that
, where and
are the population variances of the two groups.
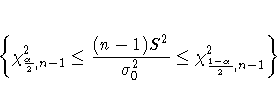
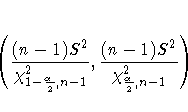
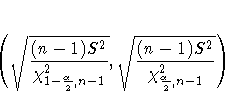
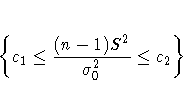
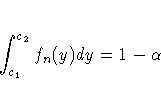
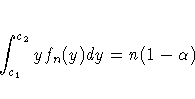
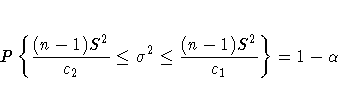
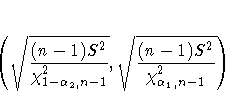
The distribution of the estimated standard deviation of a mean is not
symmetric, so alternative methods of estimating confidence
intervals are possible. PROC TTEST computes two estimates. For
both methods, the data are assumed to have a normal distribution
with mean  and variance
  , both unknown. The methods are
as follows:
, both unknown. The methods are
as follows:
Copyright © 1999 by SAS Institute Inc., Cary, NC, USA. All rights reserved.