
Article
Spatial Thinking with Julie Jones
Spatial Thinking, GIS, and Community Stories
October 19, 2016 at 7:00 PM | FREE, no registration required
Djavad Mowafaghian World Art Centre, Goldcorp Centre for the Arts, 149 W. Hastings St
GIS (Geographic Information Systems) is a method of visually representing data with a wide range of applications beyond the academic. This Wednesday, SFU’s GIS and Map Librarian, Julie Jones will give a free talk about the power of digital mapping to tell community stories, communicate divergent experiences of place, and support social justice.
She will speak to how GIS can be used to articulate and better understand complex problems patterns, and experiences, including inequality.
“There are some great examples of how spatial clusters or spatial inequality has been revealed once somebody has used GIS to create a map.”
Julie Jones works in the Research Commons at the SFU Library as a librarian for SFU’s Department of Geography as well as GIS & Map Librarian for the wider SFU community. She is a resource for those who are curious about GIS or are looking to incorporate it into their research.
Jones is also eager to help make GIS accessible to the greater public, and beyond the institution. “We are seeing the use of GIS and mapping in areas of society where we haven’t always seen it: journalism, community groups, museums. I’m very interested in these ways that GIS is coming to the general public — often in the form of community or participatory mapping — and the potential power of that.”
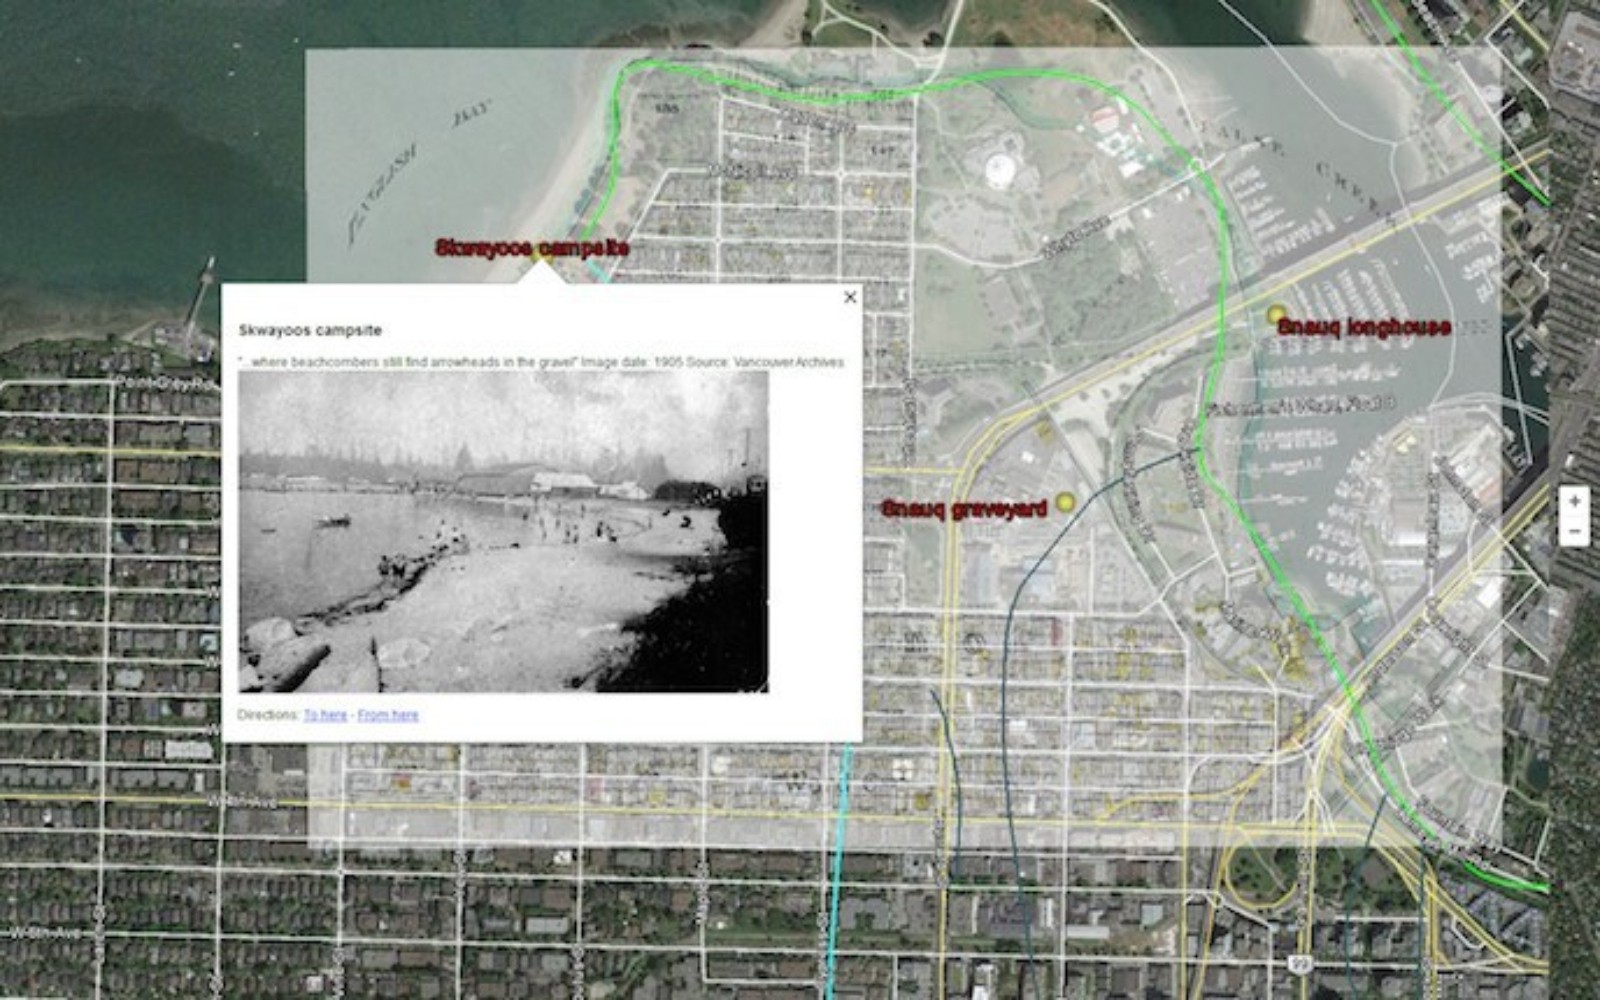
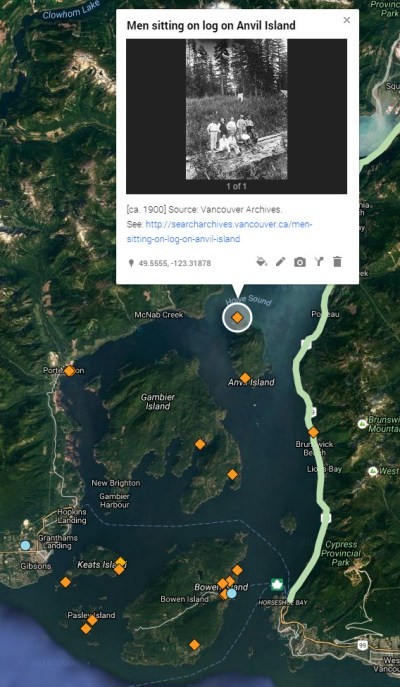
The maps that we usually encounter show one perspective of a space. In her talk, Jones will shed light on “the potential for GIS and the maps it makes possible to let us represent and consider many different perspectives of a place at the same time on a map — many different experiences of a place by different citizens, people from different walks of life, even people from different moments in history.
She shared more potential benefits of GIS as a tool for the community: “Visualizing information spatially on a map is often more powerful and user-friendly than in a spreadsheet or a text.” Mapping out data can provide visual representations of spatial inequality and pinpoint where social issues or other phenomena are clustered — or absent.
“There are some great examples of how spatial clusters or spatial inequality has been revealed once somebody has used GIS to create a map,” she added.
“I think we’re very complacent as a city sometimes and I’m interested in the potential for GIS to activate that [community engagement].
One consideration with GIS is that it is — to an extent — dependent on access to technology. Jones continued, “With that in mind, knowing that the digital divide is real and not everyone has access to technology, should cities be using touch screens and mapping in public space and making that available as part of the public infrastructure?”
In a community context, where technology is not always readily available, the principles of GIS can be applied in ways as simple as people adding post-it notes to a giant map on the wall or floor. Jones cited the Urbanarium’s Smartmap project as one of the ways mapping can be used as a platform to share perspectives on our city.
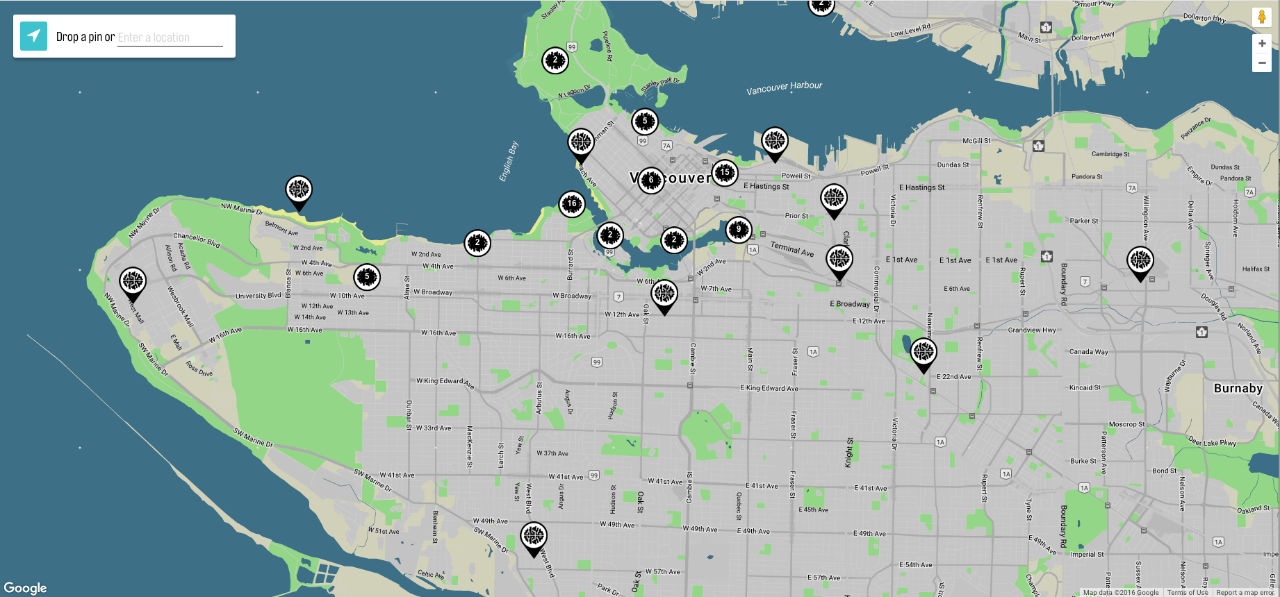
People are invited to participate online by pinpointing places on a map of Vancouver and sharing what they think is smart or not smart about that area. “They can upload photos, they can add text — and what you have is so many different experiences of the city. I’m particularly interested in spots where the experiences are drastically different. This spatial representation is allowing us to see that so compellingly,” added Jones.
“I think we’re very complacent as a city sometimes and I’m interested in the potential for GIS to activate that [community engagement]. I think we’re also grappling with increasing inequality and complexity as a city. Sometimes spatial representation of inequality or complex problems can be a really great way to kickstart us into action, to get us to ask questions and figure out why certain things are happening — and to understand our world and each other a little better.”
Latest/Related Updates
-
February 19, 2025

February 19, 2025
On behalf of SFU’s Vancity Office of Community Engagement, we wanted to take the time to say that we have been overwhelmed and deeply touched by the voices of love, solidarity and support that have been shared since the announcement of the closure of our office on January 22, 2025 by SFU.
-
January 15, 2025

January 15, 2025
Can podcasting act as a new kind of scholarly form? What are the characteristics that make a podcast scholarly, and what is the potential of scholarly podcasting beyond knowledge mobilization and public scholarship? These are the questions that the Below the Radar Academic Advisory Board approached at the scholarly podcasting teach-in this past October—the first public convention of the advisory board since their inception.
-
December 18, 2024

December 18, 2024
Between October 30th to November 10th this year, the 21st annual Heart of the City festival animated the Downtown Eastside with over a hundred community-oriented events under the theme Threads of Connection.
-
September 25, 2024

September 25, 2024
The release of States of Injury — with Wendy Brown marks Below the Radar’s 250th episode—a major milestone since the podcast’s inception in 2018.
-
July 10, 2024

July 10, 2024
On June 22, the cast and crew of Project Limelight’s production of East Side Story were greeted with applause as a full house welcomed the young performers back to the Fei and Milton Wong Experimental Theatre stage.