![]()
This page describes the source codes for the multiple description lapped transform with prediction compensation (MDLT-PC) developed in the following papers:
G. Sun, U. Samarawickrama, J. Liang, C. Tian, C. Tu and T. D. Tran, "Multiple description image coding with prediction compensation,” submitted to IEEE Trans. Signal Processing, Feb. 2007.
G. Sun, U. Samarawickrama, J. Liang, C. Tu, and T. D. Tran, "Multiple description image coding with prediction compensation," Proc. 2007 IEEE Int. Conf. on Image Processing, Vol. VI, pp. 513-516, San Antonio, TX, Sept. 2007.
Please click here to download the source codes.
The package includes the following codes:
1. Matlab codes to generate the optimal prefilter and Wiener filter for the MDLT-PC
The main function to optimize the prefilter and the Wiener filter is MDLTPC_design.m. The optimized filters are saved in the file MDPredictN*.dat, which will be used by the codec. The file can be renamed by users.
The following commands generate the two examples in Sec. IV of the paper:
[Preflt, V] = MDLTPC_design(8,8,1,0.2);
This yields V =
| 0.8787 | 0.6591 | 0.2426 | 0.1521 |
| -0.5619 | 0.8045 | 0.5009 | 0.1445 |
| 0.1165 | -0.3914 | 0.9813 | 0.2933 |
| -0.0383 | 0.0129 | -0.1641 | 1.0875 |
[Preflt, V] = MDLTPC_design(8,1,1,0.2);
This yields V =
| 0.9424 | 0.6840 | 0.1942 | 0.1046 |
| -0.5389 | 0.8658 | 0.5061 | 0.1037 |
| 0.1126 | -0.3688 | 1.0344 | 0.2773 |
| -0.0402 | -0.0001 | -0.1323 | 1.1183 |
Pre-generated filter files:
Four filter files generated by MDLTPC_design.m are provided in the package. They are used for the image coding tests in Fig. 4 and Fig. 5.
mdpredictn8_1_2_new.dat: This is generated by MDLTPC_design(8,8,1,0.2);
mdpredictn1_1_2_new.dat: This is generated by MDLTPC_design(8,1,1,0.2);
lt96151_new.dat: This is generated by MDLTPC_design(8,8,1,0.2,1);
dct_new.dat: This is generated by MDLTPC_design(8,1,1,0.2,2);
Commands to generate the MDLT-PC results in Table I:
MDLTPC_design(16,16,4,0.01);
This gives the result with M=N=16 and p = 0.01: D1D0= 1.8919e-005.
Changing the parameters will give other results. For example:
MDLTPC_design(8,1,4,0.1);
This gives the result with M=8, N=1, p = 0.1: D1D0= 2.20404e-005.
Commands to generate the TDLT-PC results in Table I (In this case, the prefilter is optimized for single description coding):
MDLTPC_design(8,2,4,0.2,1);
This generates the TDLT-PC result for M=8, N=2, p = 0.2: D1D0= 2.48524e-005.
Commands to generate the DCT-PC results in Table I (In this case, there is no prefilter, only DCT is used):
MDLTPC_design(8,1,4,0.01,2);
This generates the DCT-PC result for M=8, N=1, p = 0.01: D1D0 = 2.22704e-005.
2. The Matlab codes for the asymptotic performance analysis of the MDLT-PC (Fig. 3 and Table I of the paper)
To plot the DPCM performance in Fig. 3 in the paper, run the following command:
MDLTPC_DPCM(0.95, 0.1);
The following commands generate the first row (DPCM) in Table I (the 31-th entry of the returned vectors correspond to R = 4 bpp):
[D0, D1, D, PD0, PD1, PD, R] = MDLTPC_DPCM(0.95, 0.01);
PD0(31)*PD1(31)
ans = 1.8829e-005
Changing the last parameter to 0.05, 0.1, and 0.2 will get other results in the first row of Table I.
3. Source code of the MDLT-PC codec
The MDLT-PC codec is implemented by the Matlab function MDLTPC_codec_2DES_new.m. It first generates two descriptions, then creates the decoded results for the central decoder and the two side decoders. For example, the following command generates the results for the fourth point of the MDLT-PC (with N=8) in Fig. 4(a) of the paper.
MDLTPC_codec_2DES_new('barb2.pgm','mdpredictn8_1_2_new.dat',19,96);
The total bit rate of the two descriptions is 1 bpp. The average side PSNR is 30.374 dB, and the central PSNR is 36.812 dB.
The three decoded files are saved in MDLTPC_Dec_0.pgm, MDLTPC_Dec_1.pgm and MDLTPC_Dec_Central.pgm.
4. Matlab files to reproduce the PSNR curves in the paper:
The files MDLTPC_psnr_2DES_new.m and MDLTPC_psnr_2DES_new_025.m can plot the PSNR curves in Fig. 4 and Fig. 5. They also contain the parameters to reproduce the tests.
Please see the detailed instructions in these files.
5. Examples:
Example 1:
Fig. 6(c) in our paper is obtained by the command:
MDLTPC_codec_2DES_new('barb2.pgm', 'mdpredictn8_1_2_new.dat', 21.75, 70.3);
This yields a total rate of 1 bpp, with R0= 0.73 bpp, and R1 = 0.27 bpp. The average side PSNR = 31.668 dB, and central PSNR = 36.072 dB.

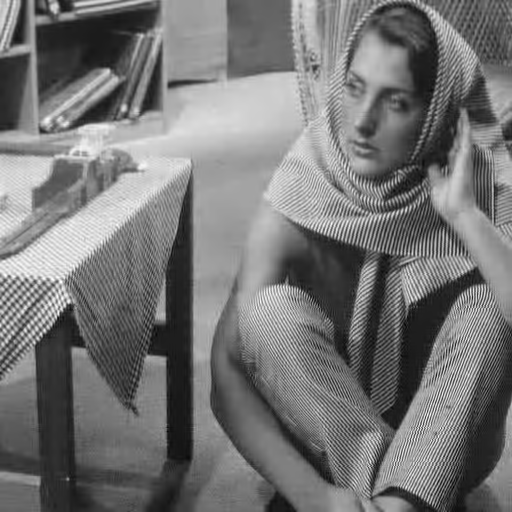
Left: Side decoding 1: 31.68 dB. Right: Side decoding 2: 31.66 dB.

Central decoding 1: 36.07 dB.
Example 2:
Fig. 6(f) in our paper is obtained by the command:
MDLTPC_codec_2DES_new('goldhill.pgm', 'mdpredictn8_1_2_new.dat', 58.4, 264.5);
This yields a total rate of 0.25 bpp, with R0= 0.229 bpp, and R1 = 0.019 bpp. The average side PSNR = 27.19 dB (at 64 : 1 compression ratio), and central PSNR = 30.35 dB.


Left: Side decoding 1: 27.17 dB. Right: Side decoding 2: 27.21 dB.

Central decoding: 30.35 dB.