Last updated on August 2, 2011
Magnetic
fields generate B-mode polarization in
the cosmic microwave background (CMB) due to Faraday rotation (FR) of
the
E-mode. Primordial fields, such as those generated in phase transitions
in the early universe, can have significant power on scales
much smaller than the thickness
of
the last scattering surface.
The CMB B-mode angular spectrum can be written
in
a
form that separates the well-established physics of FR from the
particular form of the magnetic field spectrum:
where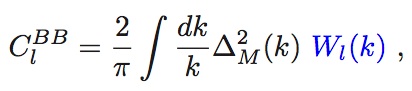 (1)
(1)
 ,
,
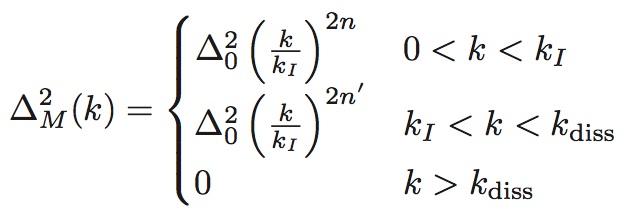
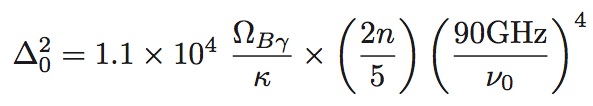 (2)
(2)
contains the dependence on the frequency at which
the CMB is observed, as well as the spectral form and
normalization of the promordial magnetic spectrum. In the above,
 ,
,  .
.
The window functions
Wl(k) are
independent of the magnetic spectrum, and instead contain the
information about the E-mode polarization spectrum and the background
cosmology. Physically, a window function Wl(k)
prescribes how much power a given wavelength k of the
magnetic field spectrum contributes to a given angular scale l of the
B-mode polarization spectrum. We have calculated the window
functions by numerically solving the full CMB
radiative transport equation with FR taken into account. Once the
window functions are calculated and stored, ClBB can be
quickly calculated using (1) for a given set of parameters appearing in
(2). For further details, and for the definitions of the parameters
appearing in (2), please refer to the paper.
To acknowledge the use of the code, please cite our paper.
You can download the clbb-code.tar.gz file
containing a short Fortran 77 code clbb.f and
a data file window_functions.dat with functions
Wl(k) stored on a
grid in l and k. The range of l is from 2 to 10000, which sets
the range of the output Cl. The range of k is from 0.0001 to 1 Mpc-1,
which
is
sufficient
for
l<10000.
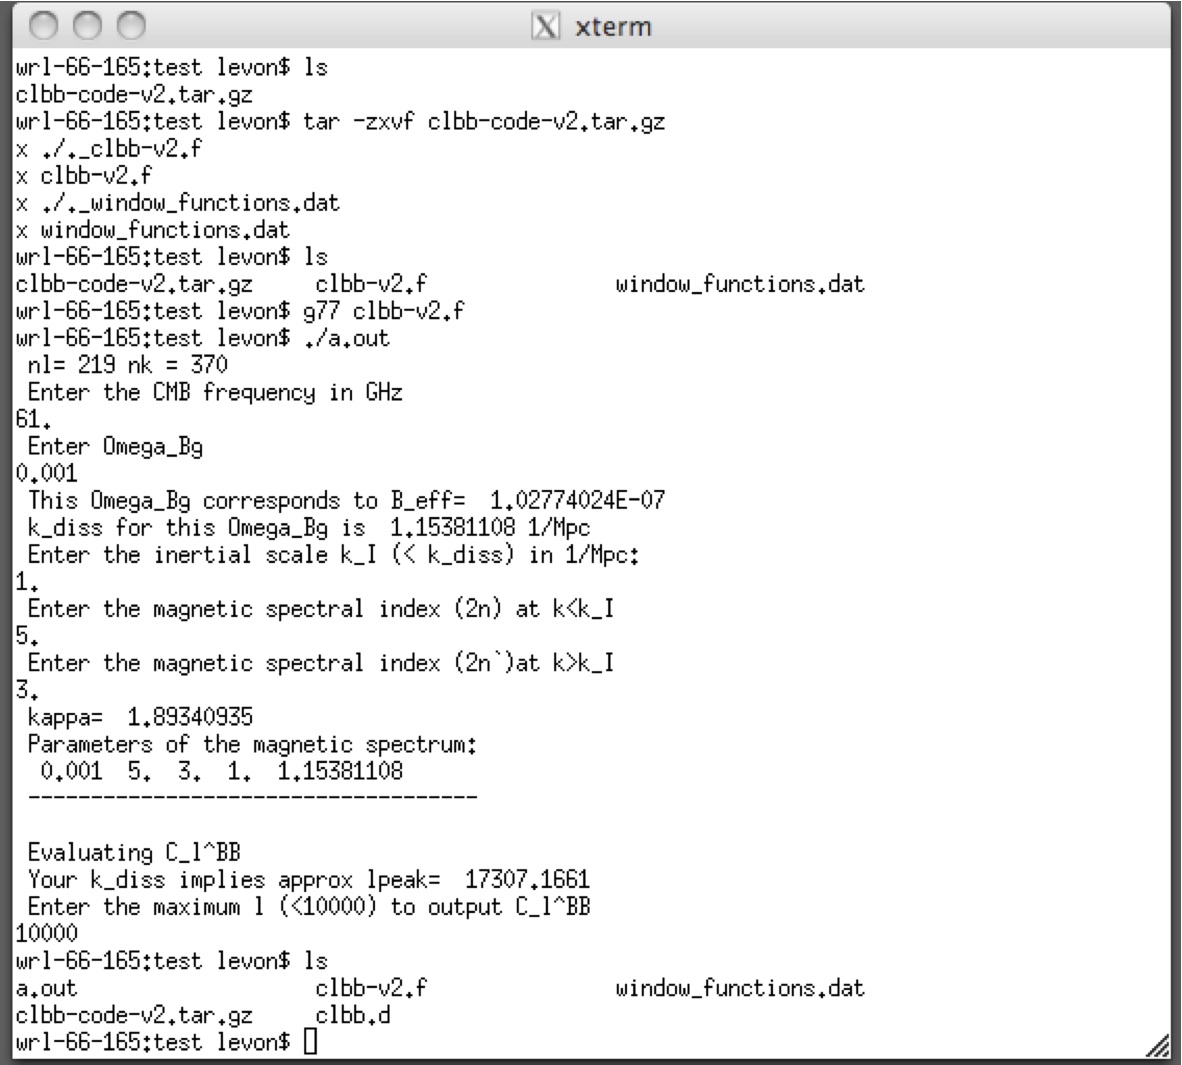
The code creates a file clbb.d where it saves the output as two columns. The first column is the multipole l (in the 2<l<10000 range), while the second column is the B-mode angular spectrum l(l+1)Cl/2pi in units of (muK)^2. The screenshot below illustrates the use of the code:
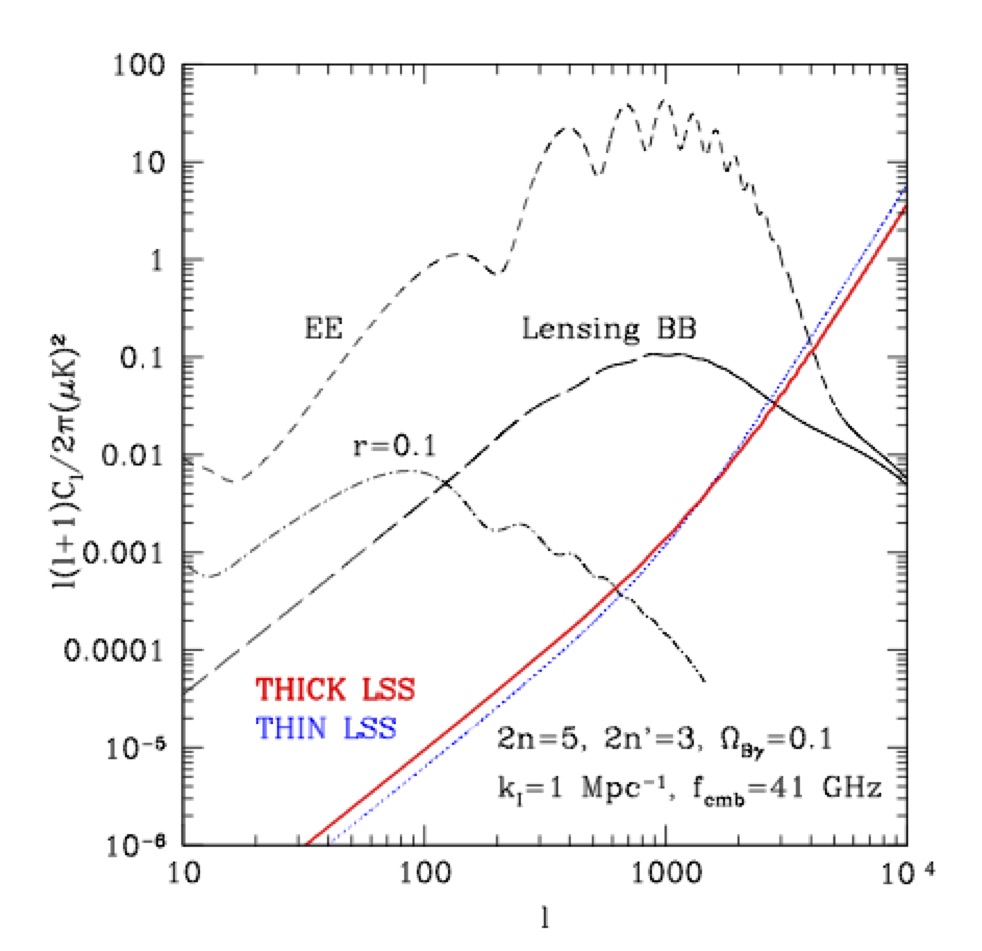
When plotted, the data in clbb.d
gives the red line in this plot, which is Fig. 4 in the paper:
With further questions e-mail levon<at>sfu.ca