![]()
![]()
![]()
Reading for Today's Lecture:
Goals of Today's Lecture:
Today's notes
A level ![]() confidence set for a parameter
confidence set for a parameter
![]() is a random subset C, of the set of possible values of
is a random subset C, of the set of possible values of ![]() such that for each
such that for each ![]() we have
we have
Suppose C is a level
![]() confidence set for
confidence set for ![]() .
To test
.
To test
![]() we consider the test which rejects if
we consider the test which rejects if
![]() .
This test has level
.
This test has level ![]() .
Conversely, suppose
that for each
.
Conversely, suppose
that for each ![]() we have available a level
we have available a level ![]() test
of
test
of
![]() who rejection region is say
who rejection region is say
![]() .
Then if
we define
.
Then if
we define
![]() we get
a level
we get
a level ![]() confidence for
confidence for ![]() .
The usual t test gives
rise in this way to the usual t confidence intervals
.
The usual t test gives
rise in this way to the usual t confidence intervals
Definition: A pivot (or pivotal quantity) is a function
![]() whose distribution is the same for all
whose distribution is the same for all ![]() .
(As usual
the
.
(As usual
the ![]() in the pivot is the same
in the pivot is the same ![]() as the one being used to
calculate the distribution of
as the one being used to
calculate the distribution of
![]() .
.
Pivots can be used to generate confidence sets as follows. Pick a set
A in the space of possible values for g. Let
![]() ;
since g is pivotal
;
since g is pivotal ![]() is the same for all
is the same for all ![]() .
Now given
a data set X solve the relation
.
Now given
a data set X solve the relation
Example: The quantity

In the same model we also have

In general the interval from
![]() to
to
![]() has level
has level
![]() .
For a fixed value of
.
For a fixed value of ![]() we can
minimize the length of the resulting interval numerically. This sort of optimization
is rarely used. See your homework for an example of the method.
we can
minimize the length of the resulting interval numerically. This sort of optimization
is rarely used. See your homework for an example of the method.
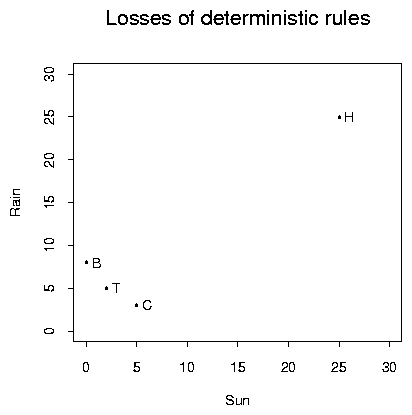
Example: I get up in the morning and must decide between 4 modes of transportation to work:
Ingredients of a Decision Problem: No data case.
In the example we might use the following table for L:
| C | B | T | H | |
| R | 3 | 8 | 5 | 25 |
| S | 5 | 0 | 2 | 25 |
Notice that if it rains I will be glad if I drove. If it is sunny I will be glad if I rode my bike. In any case staying at home is expensive.
In general we study this problem by comparing various functions of ![]() .
In this
problem a function of
.
In this
problem a function of ![]() has only two values, one for rain and one for sun and
we can plot any such function as a point in the plane. We do so to indicate the geometry
of the problem before stating the general theory.
has only two values, one for rain and one for sun and
we can plot any such function as a point in the plane. We do so to indicate the geometry
of the problem before stating the general theory.
Statistical problems have another ingredient, the data. We observe
X a random variable taking values in say ![]() .
We may make our decision d depend on X. A
decision rule is a function
.
We may make our decision d depend on X. A
decision rule is a function ![]() from
from ![]() to D.
We will want
to D.
We will want
![]() to be small for all
to be small for all ![]() .
Since
X is random we quantify this by averaging over X and compare procedures
.
Since
X is random we quantify this by averaging over X and compare procedures
![]() in terms of the risk function
in terms of the risk function
To compare two procedures we must compare two functions of ![]() and
pick ``the smaller one''. But typically the two functions will cross each
other and there won't be a unique `smaller one'.
and
pick ``the smaller one''. But typically the two functions will cross each
other and there won't be a unique `smaller one'.
Example: In estimation theory to estimate a real parameter
![]() we used
we used ![]() ,
,
Example: For my transportation problem there is no data so the only possible (non-randomized) decisions are the four possible actions B,C,T,H. For B and T the worst case is rain. For the other two actions Rain and Sun are equivalent. We have the following table:
| C | B | T | H | |
| R | 3 | 8 | 5 | 25 |
| S | 5 | 0 | 2 | 25 |
| Maximum | 5 | 8 | 5 | 25 |
The smallest maximum arises for taking my car. The minimax action is to take my car or public transit.
Now imagine each morning I toss a coin with probability ![]() of getting Heads and take my car if I get Heads, otherwise taking transit.
Now in the long run my average daily loss for this procedure would be
of getting Heads and take my car if I get Heads, otherwise taking transit.
Now in the long run my average daily loss for this procedure would be
![]() when it rains and
when it rains and
![]() when it is Sunny. I will call this procedure
when it is Sunny. I will call this procedure ![]() and add it to
my graph for each value of
and add it to
my graph for each value of ![]() .
Notice that on the graph varying
.
Notice that on the graph varying
![]() from 0 to 1 gives a straight line running from (3,5) to
(5,2). The two losses are equal when
from 0 to 1 gives a straight line running from (3,5) to
(5,2). The two losses are equal when
![]() .
For smaller
.
For smaller
![]() the worst case risk is for sun while for larger
the worst case risk is for sun while for larger ![]() the worst case risk is for rain.
the worst case risk is for rain.
On the graph below I have added the loss functions for each ![]() ,
(a straight line) and the set of (x,y) pairs for which
,
(a straight line) and the set of (x,y) pairs for which
![]() ;
this is the worst case risk for
;
this is the worst case risk for ![]() when
when
![]() .
.
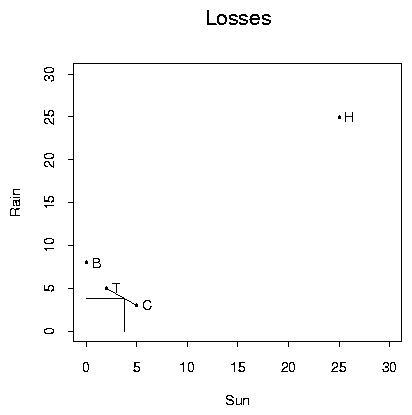
The figure then shows that d3/5 is actually the minimax procedure when randomized procedures are permitted.
In general we might consider using a 4 sided coin where we
took action B with probability ![]() ,
C with
probability
,
C with
probability ![]() and so on. The loss function of such
a procedure is a convex combination of the losses of the four basic
procedures making the set of risks achievable with the aid of randomization
look like the following:
and so on. The loss function of such
a procedure is a convex combination of the losses of the four basic
procedures making the set of risks achievable with the aid of randomization
look like the following:
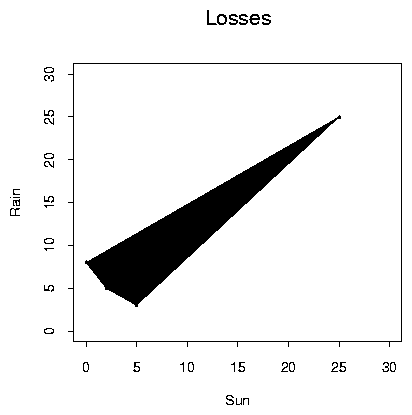
The use of randomization in general decision problems permits us to assume that the set of possible risk functions is convex. This is an important technical conclusion; it permits us to prove many of the basic results of decision theory.
Studying the graph we can see that many of the points in the picture correspond to bad decision procedures. Regardless of whether or not it rains taking my car to work has a lower loss than staying home; we call the decision to stay home inadmissible.
Definition: A decision rule ![]() is inadmissible if there is
a rule
is inadmissible if there is
a rule ![]() such that
such that
The admissible procedures have risks on the lower left of the graphs above. That is, the two lines connecting B to T and T to C are the admissible procedures.
There is a connection between Bayes procedures and admissible procedures. A prior distribution
in our example problem is specified by two probabilities, ![]() and
and ![]() which
add up to 1. If
L=(LR,LS) is the risk function for some procedure then the Bayes
risk is
which
add up to 1. If
L=(LR,LS) is the risk function for some procedure then the Bayes
risk is

Here is a picture showing the same lines for the three priors above.

The special prior (0.6,0.4) produces the line shown here:

You can see that any point on the line connecting B to T is Bayes for this prior.
The ideas here can be used to prove the following general facts:
Now let's focus on the problem of estimation of a 1 dimensional
parameter. Mean Squared Error
corresponds to using
The risk function of a procedure (estimator)
![]() is
is
