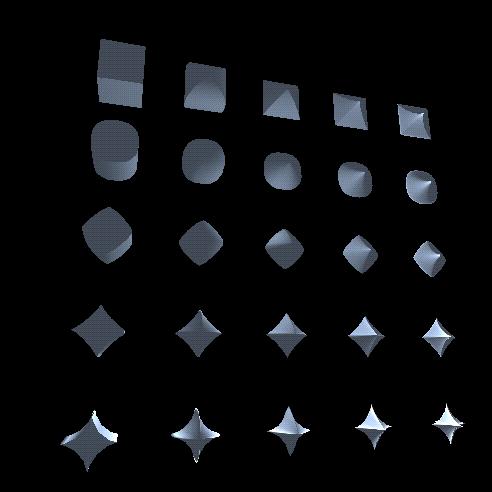
Figure 1: Example superquadric shapes created by varying each exponent from 0 to 4.
David S. Ebert [+] - James M. Kukla [+] - Christopher D. Shaw [+] - Amen Zwa [+] - Ian Soboroff [+] - D. Aaron Roberts [+]
This paper describes a new technique for the multi-dimensional visualization of data through automatic procedural generation of glyph shapes based on mathematical functions. Our glyph-based Stereoscopic Field Analyzer (SFA) system [2] allows the visualization of both regular and irregular grids of volumetric data. SFA uses a glyph's location, 3D size, color and opacity to encode up to 8 attributes of scalar data per glyph. We have extended SFA's capabilities to explore shape variation as a visualization attribute.
Because of the need for meaningful glyph design and the complexity of the problem, we opted for a procedural approach, which allows flexibility, data abstraction, and freedom from specification of detailed shapes [3]. Superquadrics, first introduced to computer graphics by Barr [1], are a natural choice to satisfy our goal of automatic and comprehensible mapping of data to shape. For our initial implementation we have chosen superellipses.
We parameterize superquadrics to allow continuous control over the ``roundness'' or ``pointiness'' of the shape in the two major planes which intersect to form the shape, allowing a very simple, intuitive, abstract schema of shape specification. (Figure 1).
Figure 1: Example superquadric shapes created by varying each exponent
from 0 to 4.
Glyph shape is a valuable visualization component because of the human visual system's pre-attentive ability to discern shape. Shapes can be distinguished at the pre-attentive stage [4] using curvature information of the 2D silhouette contour and, for 3D objects, curvature information from surface shading. Unlike an arbitrary collection of icons, curvature has a visual order, since a surface of higher curvature looks more jagged than a surface of low curvature. Therefore, generating glyph shapes by maintaining control of their curvature will maintain a visual order. This allows us to generate a range of glyphs which interpolate between extremes of curvature, thereby allowing the user to read scalar values from the glyph's shape. Pre-attentive shape recognition allows quick analysis of shapes and provides useful dimensions for comprehensible visualization.
Since size and spatial location are more significant cues than shape, the importance mapping of data values should be done in a corresponding order. In our experience, shape is very useful for local area comparisons among glyphs: seeing local patterns, rates of change, outliers, anomalies.
Figure 2 shows a visualization of document similarities generated with the Telltale system [5]. Each glyph in figure 2 represents a document in the corpus, and the document's X, Y, and Z position, color and shape each represent the similarity of the document to one of the 5 themes. Document similarity to gold prices, foreign exchange, and federal reserve are respectively mapped to the X, Y, and Z axes. Most documents lack similarity with these themes, so are clustered near the origin.
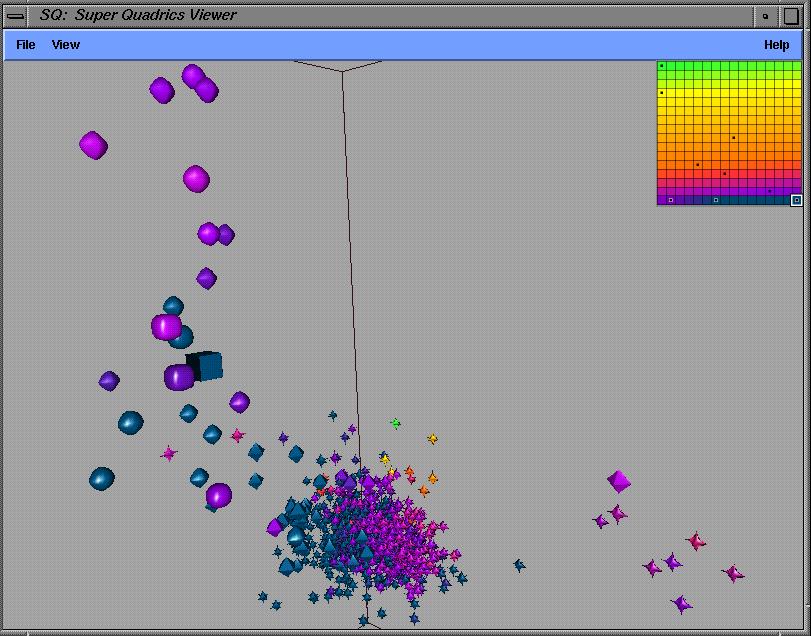
Figure 2: Three-dimensional visualization of 1833 documents'
relationship to gold prices, foreign exchange, the federal
reserve, stock prices, and Manuel Noriega.
The branch of 9 documents to the lower right are documents in the corpus that discuss both gold prices and foreign exchange. The vertical branch depicts about 27 documents that discuss both foreign exchange and the federal reserve.
Similarity to stock prices is mapped to glyph shape, with highest similarity creating cuboids, then spheres, diamonds, and stars (lowest). In figure 2 the larger, rounder shapes along the left vertical branch exhibit some significant relationship to stock prices while the more numerous star-shaped glyphs do not. Clearly the vertical branch contains articles relating foreign exchange, federal reserve and stock prices, while the lower right branch discusses only gold prices and foreign exchange.
These shapes allow the intuitive understanding of data variation among glyphs while preserving the global data patterns. We have shown the value of these techniques for both multi-dimensional information and scientific visualization.