Data
This section will describe how the data was prepared before it was uploaded to the website. After downloading and receiving all the necessary data that was mentioned in Table 5, it was important to determine the extent of the study area. The study area was determined by first examining the participant data (Figure #). Once a suitable study area was determined, all the secondary data was then clipped to that extent.
The next step was to ArcGIS’s tool select by attribute, to determine which postal code areas intersect with the participant data. This enabled the data to be more manageable(ESRI, 2013). After this, the average BMI and waistline size was determined by taking the average of the participant data in each postal code area. The data was then displayed and provided in this report (maps 1 and 2).
Due to some limitations from the data and website, which will be discussed in the Limitations section, our group wanted to process the participant data in such a way that protected the participants’ identity, but still allowed our group to upload it to our map on the website. In order to hide the participants’ location, the first step was to put a 1000m buffer around the point. Then by using ArcGIS’s create random point tool, a random point was placed somewhere within the previously created buffer(ESRI, 2013). The last step was to create another 1000m buffer around the random point. This processes provides masks the location of the original data, while still providing a general location.
Website
Implementation of Frameworks
The implementation of the web interface includes three defining technologies that allow us to implement and use a mapping product that can be easily included in any website. This web interface is called a Web Mapping Service, also known casually as a WMS. The defining ability of a WMS is allowing the user to save and serve spatially correlated data in a range of formats including both PostgreSQL data tables as well as ESRI shapefiles. We then utilize a web framework known as OpenLayers to include a javascript library that allows for dynamic implementation of a typical web mapping container. While this could be implemented in an easier fashion with the use of paid for tools such as ESRI ArcServer, or by using Googles API, this particular implementation was chosen to both reduce cost to the client, and to ensure we have not inadvertently given information to any outside companies.
Java Servlet Container and Server: Tomcat 7.0.1

What is a servlet container?
A java servlet is considered to be a java application that is often connected to a web server (Java Servlet, 2014). A Java servlet container, of which Tomcat 7.0.1 is just one, is used to contain and direct the requests made by each individual java servlet. Due to the use of OpenLayers as our display medium, Tomcat 7.0.1 becomes an extremely useful tool in the implementation of our Web Mapping Service.
Why is a servlet container useful to us?
The use of a servlet container allows the web server to create and configure an active java servlet once called upon by the web server. Upon receiving an HTTP request, the web server will forward the request to the java servlet container, the container will then load, initialize, and process the request in a dynamic fashion and respond to the client with this newly instantiated servlet package (What is a Servlet Container, 2014). This process can be seen more clearly in figure 1.
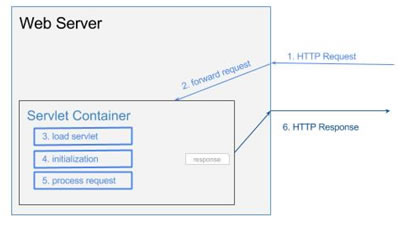
Figure 1. Workflow of a HTTP request
This implementation of a java servlet is required to ensure that our mapping service is a dynamic and changing entity and not just a statically served single image. This implementation allows for better user interaction with the chosen content and allows for greater access to the stored information.
Why we chose Tomcat 7.0.1
Tomcat 7.0.1 was chosen for this particular project, as it is a well-known open source implementation of a java servlet container that has been extensively tested, and ensured to be a stable version of this product.

Web Mapping Service: Geoserver 2.4.5
What is a Web Mapping Service?
A Web Mapping Service is a OpenGIS specification that standardizes the way in which web applications request maps (OpenGeoSpatial.org, 2014). Because this is an OpenGIS standard a lot of work has been previously done, and may be used by the client to implement any future developments as requested. The WMS allows us to create a single server location that can then serve multiple web applications. This means that our mapping framework can be used and implemented in as many websites as the client wishes. This is a useful tool in allowing for greater access to this information, while still retaining all the necessary data specifications required by the project. Advanced Web Mapping Services can also be to do some amounts of geospatial analysis. Due to their standardization, many mapping services include similar functions and abilities.
Why is a WMS useful to us?
The WMS is useful in our situation as it is a way to quickly and easily serve up data that can be stored in many different formats, including PostGIS, Shapefile, ArcSDE, DB2 and Oracle (Geoserver Features, 2014). This also allows us to retain control over our own data as we have all the data stored on our native server, if we need to remove data, or add data it is a simple process that only requires access to our own server. This data can also be used in many instances, and can be served up to as many web applications as is required by the client. One drawback to this method of implementation is the focus on OpenGIS abilities; this means that anyone that obtains the IP address of our server can serve our data for their own web applications. While this can be considered a problem, this user will not be allowed to add, alter, delete, or obtain any of the spatial data files due to password protection on the WMS itself.
Why we chose Geoserver?
We have chosen to use the geoserver implementation, as it is a well-defined application that is more powerful then solely being a Web Mapping Service. The inclusion of a simple web interface that allows for administrative GUI interaction is a large part of our reasons for implementing the WMS using Geoserver 2.4.5

Javascript Display Container: OpenLayers
Javascript library implementation
In order to view all the spatial data and information we have included in our Web Mapping Service, we need a tool to display the information that retains all the required spatial and attribute data. To implement this display we use something called a Javascript Library. The particular library we have chosen to use is called OpenLayers. A Javascript library is a set of pre-defined code that allows the developer to implement advanced and complex interaction, with minimal extraneous and duplicate coding. This vastly cuts down on implementation time, while retaining efficient code that is easily maintained and altered.
Utilization in this project
The utilization of OpenLayers library has enabled a wide range of efficient implementations such as navigation, zoom, and draw style manipulations. OpenLayers allows the developer to change and implement the layers, select which layers we wish to show or hide, overlay transparency and allow for significantly increased interaction then would have otherwise been possible. Due to the applications nature, the implementation of OpenLayers allows us to easily include this mapping and viewing functionality to any existing website, all that is required is a division container tag and the inclusion of the OpenLayers library and the attending javascript code.
Administration of the Geoserver Data Store
Logging in to your Geoserver implementation:
Logging in to your geoserver is as simple as visiting a regular webpage through your preferred browser, as most development has been done using Google Chrome, this is the suggested browser to use. The URL to visit is as follows:
http://142.58.127.116:8080/geoserver/web/
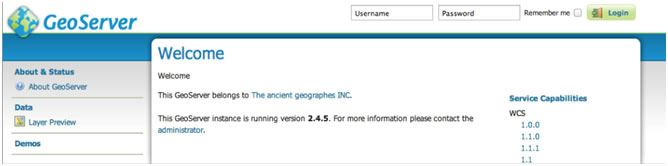
Geoserver will then require a Username and Password in order to log into the system and allow for any administrative processes to occur. Currently the only User with all allowed privileges is:
Username:Wes
Password: wes
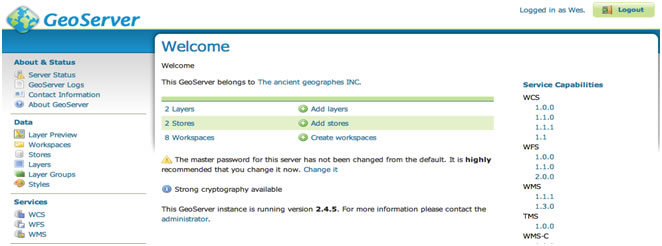
Upon Login, you can view all stores, layers and workspaces available to you.
Adding Data to your Geoserver:
In order to add data to your Geoserver a few steps are required, you must have the data on your home drive, have an active Internet connection, know the server information, and have access to the terminal.
Step 1. Assuming the folder you wish to transfer to the server is on your machine in the Desktop engage terminal and type the following statement:
scp -r ~/Desktop/*YourFolderName*
geog455@142.58.127.116:/home/geog455/Desktop
Replace *
YourFolderName* with the actual name of your folder, this will then ask for a password, the password is GEOSERVER in all capital letters. Once the folder has finished transferring to the server you will need to then log into the server itself using a function called ssh, to do this simply input the following command in terminal
geog455@142.58.127.116
Again the server will ask you for the password: GEOSERVER is the correct password again. Now that you have successfully logged into the server you will want to move the file from the Desktop to the appropriate geoserver data folder, to do this the last command is as follows:
sudo mv ~/Desktop/*YourFolderName* /var/lib/tomcat7/webapps/geoserver/data/data/
This then moves your data into the correct folder so that geoserver can see and serve the data correctly.
Step 2. Log into the geoserver as stated in section 1 of this manual. Select Stores, from the left hand menu.
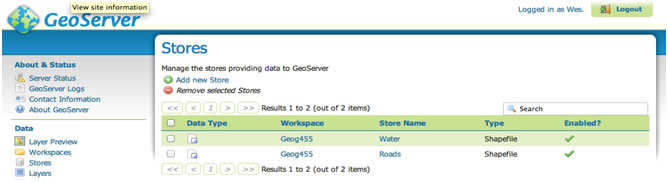
Clicking "Add new Store" as above, options are given as to the type of data we wish to add, this will likely be an ESRI shapefile, so select this file type to create a new data store. The next screen will ask you for a source name, and the file destination.
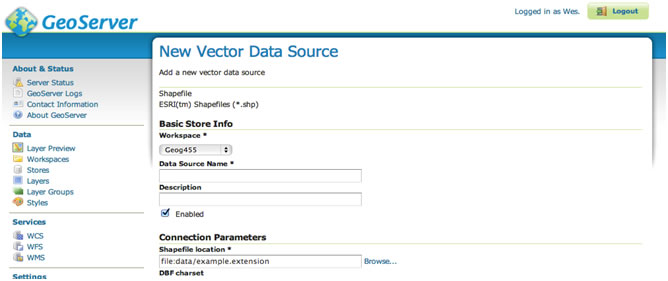
Input an appropriate name for the data; use only english characters and no spaces. Select the Browse... button to select the shapefile that you have just moved to Geoservers data folder and select save at the bottom of the page. On the right hand side of the next page we need to select Publish, this will allow us to use the newly linked data in our web applications.
This brings us to the final step in adding data to the Geoserver. This page asks for a name, and title, both of which should be the same as the "Data Source Name" you created above. This name will be used to call on each layer when implementing the OpenLayers application.
As you scroll down the page most selections can be left as their default values, however, three selections must be set in order to correctly publish your new data store.
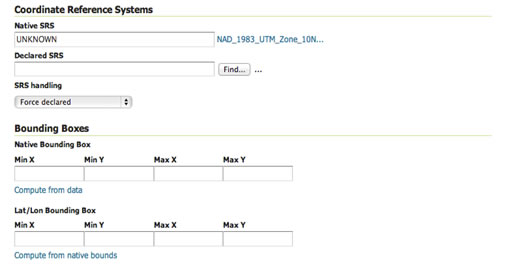
The Declared SRS, is the projection that will be used to define your data, there are many built in projections, to select one simply hit find, and select the projection you wish to use.
The Bounding Boxes, the easiest way to do this is to simply select "Compute from Data" for both boxes, however you must ensure the Declared SRS is selected before you select these options.
Once all of this is completed simply select Save at the bottom of the page and your new data is successfully stored in the Geoserver and can be accessed by your web implementation.
Quick Reference Guide:
IP: 142.58.127.116
Username: geog455
Password: GEOSERVER
scp -r ~/Desktop/*YourFolderName*
geog455@142.58.127.116:/home/geog455/Desktop
Transfers files from your computer to the server
geog455@142.58.127.116
Logs you into the server to allow moving files
sudo mv ~/Desktop/*YourFolderName* /var/lib/tomcat7/webapps/geoserver/data/data/
Moves files to the correct storage folder for geoserver to access
Geoserver Username: Wes
Geoserver Password: wes