Discussion

,

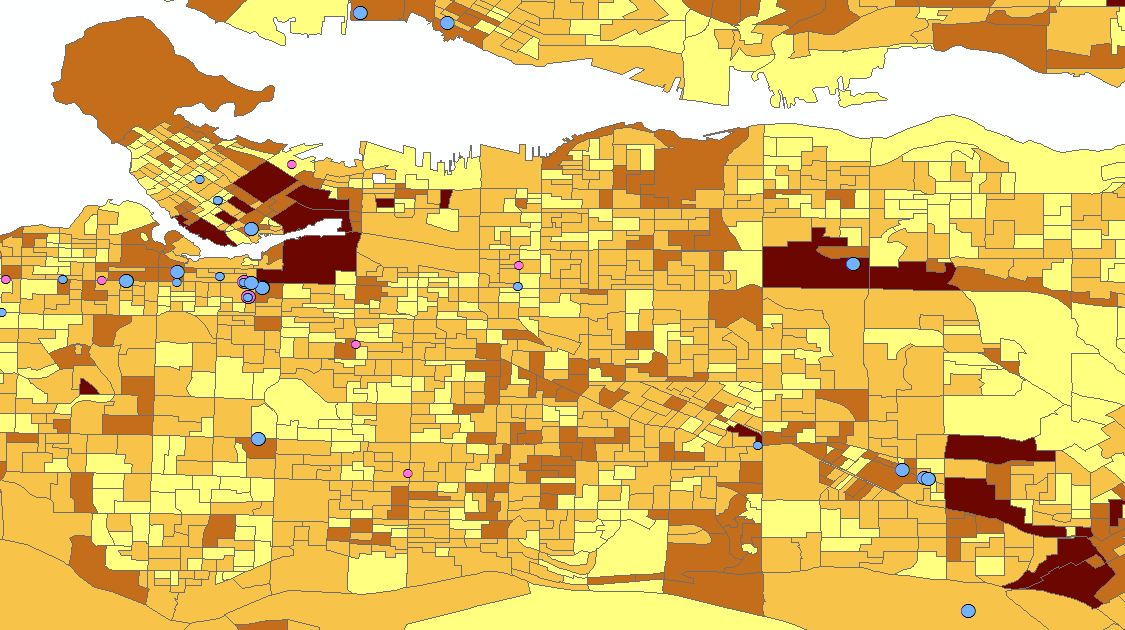
Our analysis of dental networks and their relationship to oral dysplasia and socio-economic status is one example of how spatial decision support systems can be applied to the health sciences and epidemiology. In this case, visual communications of the spatial distributions of oral dysplasia biopsy reports, dentist offices, and socio-economic status can be used for the assessment and application of health care initiatives, health service legislation, and targeted educational programs for risk reduction.

The correlations between the VANDIX scores and Dental Office locations provided useful statistics with the OLS method, such as a p-value < 0.05, which denotes non-random, positive correlation between the two variables. Although this is a good indication that there is a relationship between Dental office locations and medium-high socio-economic status, it is difficult to determine how or why SES is related to oral biopsy counts. This is because OBS centres are not spatially representative of where patients live and therefore accurate correlations between individuals and their SES are difficult to determine.

The following section contains the references we used throughout our full research report.

Limitations

,

Accessibility

Since physicians outside of the study area are not accounted for in this analysis, results near the boarders of the study area need to be interpreted with caution.

Census Data

2011 Canadian Census data was used in VANDIX and 2011 accessibility analysis respectively, but unfortunately on that year the Canadian government change the policy such that it was no longer mandatory to complete the detailed long form census. As a result, there are inherent bias within parts of the data used in this project. However, this data is the latest census data available to all researchers, thus everyone using this data will be affected.


The VANDIX created for this project using the 2011 NHS census data appears to have a response rate similar to the response rate for all of Canada. This is a good indication that although there are some issues with the data we use for BC, there area as many responses within BC as there are for the average response rate in all of Canada.

Contact Us

Our team consists of three undergraduate students from Simon Fraser University, although we will have graduated by the end of this project, please feel free to contact us with any questions you may have. We will do our best to help.

Address:Department of Geography, 8888 University Drive, Burnaby, BC
Reuben French: reubenf@sfu.ca
Andrew Kwok: ack10@sfu.ca
Toby Zhang: tobyz@sfu.ca