Socioeconomic Status
SES was included in this study in order to compare the social and economic characteristics of a neighbourhood to the presence and quality of the play space within that neighbourhood. Such a measure would also provide a rating of neighbourhood health and wellbeing. While these indicators may not provide specific information about the neighbourhood, such as the distribution of heart disease or diabetes, they can be used to establish a rating of potential health risk at a more suitable spatial resolution. These measures are an important factor to include for assessing areas according to their need for green/play spaces.
This project created a SES measure for the study area by calculating the Vancouver Area Neighbourhood Deprivation Index (VANDIX) scores, which is a census-based measure of SES that allows for the analysis of the distribution of health status in an urban population using social and economic indicators. This index was chosen for this project because it was easy to reproduce while providing a representative proxy measure of population health at a more appropriate geographic scale than provincial health authority boundaries (Bell 2012).
The interactive map below identifies the calculated SES of all DAs in the City of Vancouver. Due to the limitations of the online mapping system the DAs had to be grouped into five classes and each DA can not be explored individually. Each class can be identified by clicking on the respective color in the map.
View larger map
Calculating VANDIX
The VANDIX uses seven elements collected from the Canadian Census, including; no high school completion, university completion, unemployment rate, proportion of lone-parent families, average income, home ownership, and employment ratio. The data that was included for these variables was obtained from the 2011 Canadian Census and the 2011 National Household Survey. The table that is included below provides more information about each of the variables included in the VANDIX calculation.
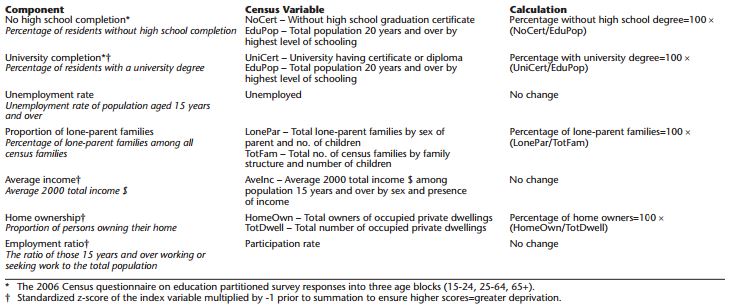
The VANDIX calculation produced a deprivation index for each DA in the City of Vancouver. Positively weighted scores indicate areas of greater disadvantage or poorer health (lower rated SES) and negatively weighted scores indicate areas of lesser disadvantage or better health (higher rated SES). In the map above the highest SES is indicated by the dark red and lowest SES by the light red. These SES scores were included in the final playability MCE. Those areas with the highest SES were considered to have the highest health and were therefore the most likely to promote active outdoor activities. As such they received the higher rank in the playability analysis and low SES neighbourhoods received the lowest.