


Methodology
to begin...
With the purpose of finding the ideal placement(s) of a new cellular tower on Vancouver Island in mind, I began with the process of digitizing the prominent cities of Vancouver Island onto the base raster file vanisle.rst. I added the layers isldhwy.vct and m_roads.vct on top of vanisle.rst, during my digitizing to aid me in proper placement of the digitized cities. I saved the newly digitized cities as a vector file and named it cities.vct. The city names were also hand digitized and created into a vector text layer and entited citynames.vct. The relative residential concentrations were taken from the file landuse.rst. I had to use the RECLASS function to isolate only the data of interest from the raster set. I set values of 1 to the urban data value, and a value of 0 to all other values. This created a raster image with only the residential areas showing. I then used the RASTERVECTOR operation within Idrisi Kilimanjaro to convert the raster file into vector format to allow me to display the results over my base raster image vanisle.rst. Using RASTERVECTOR, i chose to convert a raster image to a vector polygon image and used vanisle.rst as the reference file. The resulting file i called residential.vct and added this layer on top of vanisle.rst along with my digitized city and city name layers. The resulting image is displayed below.

Next, I added the vector files m_roads.vct and isldhwy.vct on top of my raster file base vanisle.rst. The resulting image is shown below.

Next, I added the vector files ovcamp.vct, hunting.vct, and fishlake.vct ontop of my vanisle.rst base to show the major recreational and tourism spots on Vancouver Island. They represent the areas of camping, hunting and launch sites for boats respectively. I chose to proper palette to effectively display such spots and the resulting image is show below.

Next, I had to digitize the exisiting Telus Mobility cellular towers. For the locations of these towers I used the equipment maps at the GeckoBeach website located at:
http://www.geckobeach.com/cellular/maps/default.htm
I saved the digitzed points as a vector layer and named it currenttowers.vct. I added the layer ontop of the vanisle.rst layer and the resultant image is shown below:

I next wanted to show the existing coverage of Telus Mobility from their current towers. One cellular tower reaches an approximate circular radius range of about 20km. This does not take into account varying conditions of the atmosphere or changes in landscape that may decrease the coverage. But for this project, a standard value had to be used. I had to convert my digitized vector layer of currenttowers.vct into raster format before i could use the BUFFER distance operation. I again used the RASTERVECTOR operation to convert the vector into a raster format. I then applied the BUFFER function to create 20km buffer zones around each existing cellular tower. Upon creating the zones, i used the RECLASS function to reclass all the seperate buffer zones into one class. I set values of 1 for all areas within the buffer radius and a value of 0 for all values outside. I then used the RASTERVECTOR operation to convert the buffer zones into vector format so i could overlay them on top of my other data layers. I used the RASTERVECTOR operation again and converted the raster layer into a vector polygon layer and saved theh file as currentcoverage.vct. I placed the currentcoverage.vct layer ontop of the recreational activity layers as well as residential layer and the resulting image is shown below.

initial analysis...
The above layers created allowed me to being my intial steps into spatial analysis of the data I had. I had decided to compare results of both Multi Criteria Evaluations using Boolean Intersection and also Weight Linear Combination methods.
The criteria for my models I decided upon were the following:
- Distance from the city centre: This was important as population concentrations are concentric around a centre area. Placing a tower close to the city centre would allow the tower to provide coverage to a large concentration of population.
- Distance from recreational activities: As stated in the introduction, Vancouver Island is a great location for recreation and tourism. Placing a tower close to such recreational sites would allow maximum growth of potential consumers of Telus Mobility
- Distance from major roads: Travel is important on Vancouver Island as it is for much of the world. This factor also influences the accessibility of the recreational activities. Placing a tower close to major roads and highways would allow for maximum potential usage by "mobile" Telus Mobility consumers travelling throughout Vancouver Island.
- Current Coverage Area: The placement of the new cellular tower would ideally be in an area currently lacking coverage, yet overlapping current coverages as this provides maximum of potential of new consumers in that area that had previously no exisiting Telus Mobility service and also bolstering previous cellular coverages.
- Distance from Residential Areas: As stated before, people consider cellular towers a health risk and unlikely agree to placement of a tower in their neighborhood. A buffer zone would therefore be required to enable the tower itself to be far away from such settlements, yet still provide coverage to potential consumers.
Boolean Intersection:
With the use of the Boolean Intersection method, I knew that my end result would yield new cellular tower placement locations that fit all my criteria. I first had to create boolean images for all the above criteria. This involved converting vector files to raster files, and reclassifying the raster files into the boolean images.
1.) Distance from The City Centre:
I used the RASTERVECTOR operation to convert cities.vct, my digitized layer of the prominent cities of Vancouver Island, into a raster file. I then decided upon a 10km buffer zone as the ideal maximum extent a new tower should be placed from such a city. The reason for this decision was due to simple mathematics. The diameter of the circular area of coverage of a tower extends to about 20km, therefore the radius would be 10km. Any tower placed about 10km away from the city centre would still extend be able to include it in its area of coverage.
I used the BUFFER distance operation to create the 10km buffer zones around the city centre points. Next I reclassed all the points using the RECLASS operation.I reclassed the areas within the buffer zones as 1 for being suitable, and all areas outside the buffer zones as 0 for being unsuitable. The resulting buffer and boolean images are displayed below. (click on them to see enlarged images)


2.) Distance from Recreational Activities:
I decided to combine all three major recreational activity vector layers into one raster layer to allow for easier analysis. I used the RASTERVECTOR operation to convert ovcamp.vct, hunting.vct, and fishlake.vct into raster files. I then used the OVERLAY operation (using the AND function) to combine the three images into one. I then used the BUFFER distance operation to create 2km buffer zones around the features. I decided upon this number arbitrarily, as I believed that tourists and recreationalists alike prefer not to see a freestanding cellular tower near their place of rest and relaxation, yet would like to use their mobile phones. A 2km buffer allows for a distance object in their view, while still maximizing a large area of recreation for potential growth of service for Telus Mobility. I then reclassified the buffer image with a value of 1 for areas within the buffer as suitable and a value of 0 for areas outside the buffer as unsuitable. The resulting buffer and boolean images are shown below. (click on them to see enlarged images)


3.) Distance from Major Roads:
I used the RASTERVECTOR operation to convert m_roads.vct and ildhwy.vct into raster files. I then used the OVERLAY operation (using the AND function) to combine the two images into one. I then used the BUFFER operation to create 2km buffers from all the major roads. This again was an arbitrary number I believed would both locate the tower far enough from travellers while maintaining maximum potential growth of consumers for Telus Mobility. I used the RECLASS function to assign a values of 1 for all the areas within the buffer zones as suitable and 0 for all areas outside the buffer zones as unsuitable. The resulting buffer and boolean images are shown below. (click on them for enlarge images)


4.) Distance from Current Coverage Area:
Having already created a 20km buffer image previously for my current coverages (see currentcoverages.jpg above), I reused the same raster file to create the boolean image. I used the RECLASS operation to reclassify areas within the buffer zone (value of 1) for suitable, and areas outside the buffer zone (value of 0) for unsuitable. The resulting boolean image is displayed below.(click on for an enlarge image)

5.) Distance from Residential Areas.
Having already reclassified from the landuse.rst the residential areas of interest, I took that raster file and created a 5km buffer zone around the urban residential areas. This number was an arbitrarily chosen number as I believed 5km was a suitable distance to place away from residents. I used the BUFFER distance operation on my reclassified landuse file around the residential areas. I then used the RECLASS operation to assign a value of 1 for all areas within the buffer zones as suitable and a value of 0 for all areas outside the buffer zones as unsuitable. The resulting buffer and boolean images are shown below (click on them for enlarged images).


With all 5 boolean images ready I used the Decision Manager in Idrisi Kilimanjaro to combine all 5 boolean images. Using the Multiple Criteria Evaluation option in Decision Manager, and also choosing the Boolean Intersection method, a resulting combine Boolean Image was created that showed all the pixeled areas that displayed a value of 1 in all 5 previously made boolean images. The resulting image is shown below.
Weighted Linear Combination:
With the use of the Weighted Linear Combination method, I was allowed to have tradeoffs and risks between the criteria i had chosen. This allowed for possible locations which did not fit the "all or none" boolean intersection method, but yet yield very high possibilities of locations to consider.
The boolean criteria above still fit, but I had to seperate them into factors and constraints for analysis.
FACTORS:
- Distance from the city centre factor: This was important as population concentrations are concentric around a centre area. Placing a tower close to the city centre would allow the tower to provide coverage to a large concentration of population. Suitability in this factor will decrease with increasing distance from the city centre
- Distance from recreational activities factor: As stated in the introduction, Vancouver Island is a great location for recreation and tourism. Placing a tower close to such recreational sites would allow maximum growth of potential consumers of Telus Mobility. Suitability in this factor will also decrease with increasing distance from the recreational sites.
- Distance from major roads factor: Travel is important on Vancouver Island as it is for much of the world. This factor also influences the accessibility of the recreational activities. Placing a tower close to major roads and highways would allow for maximum potential usage by "mobile" Telus Mobility consumers travelling throughout Vancouver Island. Suitability in this case will again decrease with increasing distance from the major roads.
- Current Cell Towers and Coverage Area factor: The placement of the new cellular tower would ideally be in an area currently lacking coverage, as his provides maximum of potential of new consumers in that area that had previously no exisiting Telus Mobility service. The suitability in this factor will increase with increasing distance from other existing cellular towers.
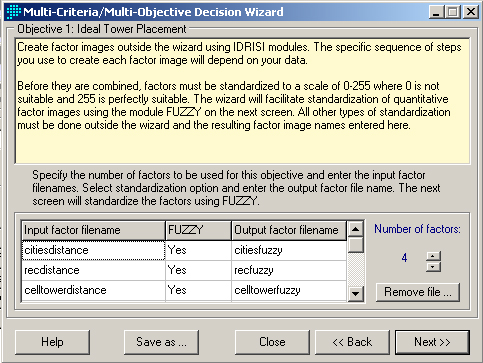
Input of factors into Decision Manager. The fuzzy operation allows for the standardization of suitability factors from a range of 0 - 255.
CONSTRAINTS:
- Residential Areas constraints: As stated before, people consider cellular towers a health risk and unlikely agree to placement of a tower in their neighborhood. A buffer zone would therefore be required to enable the tower itself to be far away from such settlements, yet still provide coverage to potential consumers.
- Land constraints: One can not build a tower on water, so only areas of land are feasible

Input of constraint factors. My two contraints allows me to exclude specific areas for consideration, effectively giving them all 0 for suitability on the standardized range of 0 -255.
I first had to create the proper distance images for the factors to apply into Idrisi Kilimanjaro's Decision Wizards WLC aggregation operator. This required me to use the DISTANCE operator to create images for input. Having previously created raster images for the factors in my Boolean Intersection Analysis stage, i reused the images and applied the DISTANCE operator for the follow raster files (created above through the RASTERVECTOR conversion steps). The next step requires using the FUZZY operation to standardize my factor images. This step is required in order to reclassify suitability for my images from a range of 0 - 255 instead of just 0 and 1. This allows for weighted constraints to be applied instead of the "all or none" method of Boolean Intersection. Pixel values of 0 would represent the no suitability, whereas pixel values of 1 to 255 would represent an increasing range of suitability with 255 being the greatest suitability. The following images were produced: (Click on below images to enlarge view)
cities.rst - Distance from City centre: I used a simple linear distance decay function


recreation.rst - Distance from Recreational Centres: I used a simple linear distance decay function


roads.rst - Distance from major roads: I used a simple linear distance decay function


celltower.rst - Distance from current cell towers: I used a monotonically increasing sigmoidal function


The constraint images I was able to reuse the reclassified boolean images in the above Boolean Intersection analysis for the residential areas with a 5km buffer. For the land constraint reclassified the vanisle.rst raster file with a value of 1 for suitable and a value of 0 for unsuitable (land and water). The two images are shown below. (click on them for enlarged images)


Using the WLC method allows me to assign weighted values of more or less importance for my 4 factors. I decided that placement of the new tower near recreational facilities and major roads would be more important than near city centres and being away from current towers. The weighted factors are shown below along with the resulting calculated eigen values which had a consistency ratio of 0.01:


The eigenvector of weights is :
citiesfuzzy : 0.1013
recfuzzy : 0.4489
celltowerfuzzy : 0.1013
roadsfuzzy : 0.3485
Consistency ratio = 0.01
Consistency is acceptable.
After running the operator, the resulting image with weighted constraints and limiting factors is shown below:
