Data
ß
|
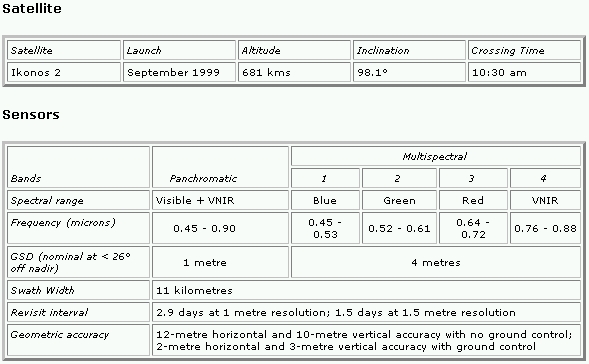
IKONOS multispectral high-resolution images of Scotty Creek basin acquired summer 2000
West side of Scotty Creek basin file PO_50586.pix
(52.4 MB) July 20, 2000.
East side of Scotty Creek basin file PO_50588.pix
(82.2 MB) September 1, 2000.
The original resolution was 1 x 1 meter resolution for each band with composite (4 bands)
imagery resolution of 4 x 4 meters. Raster image size of 2515 columns x 4182 rows indicating the image
length is greater in the North-South direction. Total ground distance covered is 10060 meters in
East-West direction and 16728 meters in North- South direction. Total area covered 16843 hectares or
168 km2.
DATUM UTM NAD27 zone 10
IMAGE EXTENTS
Top left corner
Latitude 61:24:22.53N Northing 6808943.02N
Longitude 121:21:19.23W Easting 587811.33E
Bottom right corner
Latitude 61:15:13.52N Northing 6792215.02N
Longitude 121:10:32.81W Easting 597871.33E
One Landat TM image acquired in 1992 over Fort Simpson area.
Saved at PCI .pix file on CD ROM.
Spatial Resolution
A Landsat-4 or -5 TM scene has an instantaneous field of view (IFOV) of 30 meters by 30 meters
(900 square meters) in bands 1 through 5 and band 7, and an IFOV of 120 meters by 120 meters
(14,400 square meters) on the ground in band 6.
Spectral Sensitivities of Landsat Thematic Mapper Imagery
0.45-0.52 um BLUE (BAND 1)
-shorter wavelengths most sensitive to atmospheric haze and so images may lack tonal contrast
-shorter wavelengths have greatest water penetration (longer wavelengths more absorbed);
optimal for detection of submerged aquatic vegetation (SAV), pollution plumes, water turbidity and sediment.
-detecting smoke plumes (shorter wavelengths more easily scattered by smaller particles).
-good for distinguishing clouds from snow and rock, and soil surfaces from vegetated surfaces.
0.52-0.6 um GREEN (BAND 2)
-sensitive to water turbidity differences, sediment & pollution plumes
-covers green reflectance peak from leaf surfaces, can be useful for discriminating broad vegetation
classes
-also useful for detection of submerged aquatic vegetation (SAV).
-also useful for penetration of water for detection of SAV, pollution plumes, turbidity and sediment.
0.63-0.69 um RED (BAND 3)
-senses in strong chlorophyll absorption region, i.e. good for discriminating soil & vegetation
-senses in strong reflectance region for most soils
-delineating snow cover
0.76-0.9 um NEAR IR (BAND 4)
-distinguishes vegetation varieties & and vegetation vigor.
-water is a strong absorber of NIR, so this band is good for delineation of water bodies & distinguishing dry & moist soils
1.55-1.75 um MID OR SWIR (BAND 5)
-sensitive to changes in leaf-tissue water content (turgidity)
-sensitive to moisture variation in vegetation and soils; reflectance decreases as water content increases.
-useful for determining plant vigor and for distinguishing succulents vs. woody vegetation
-especially sensitive to presence/absence of ferric iron or hemitite in rocks
(reflectance increases as ferric iron increases)
-discriminates between ice & snow (light toned) and clouds (dark toned)
2.08-2.35 um MID OR SWIR (BAND 7)
-coincides with absorption band caused by hydrous minerals (clay mica, some oxides, and sulfates) making them appear darker; e.g. clay alteration zones assoc. with mineral deposits such as copper
-lithologic mapping
-like band 5 sensitive to moisture variation in vegetation and soils.
10.4-12.50 um LWIR, THERMAL (BAND 6)
-sensors designed to measure radiant surface temps -100C to +150C; -day or nigthtime use
-heat-mapping applications: soil moisture, rock types, thermal water plumes, household heat conservation, urban heat generation, active military targeting, wildlife inventory, geothermal detection.
http://edc.usgs.gov/glis/hyper/guide/landsat_tm
Landsat TM Band Combinations
3,2,1 This RGB combination simulates a natural color image. Sometimes used for coastal studies and detection of smoke plumes.
4,5,3 Used for the analysis of soil moisture and vegetation conditions. Also good for location of inland water bodies and land/water boundaries.
4,3,2 Known as false color Infrared; this is the most conventional band combination used in remote sensing for vegetation, crops, land use and wetlands analysis.
7,4,2 Analysis of soil and vegetation moisture content; location of inland water. Vetetation appears in shade of green.
5,4,3 Separation of urban and rural land uses; identification of land/water boundaries.
4,5,7 Detection of clouds, snow, and ice (in high latitudes especially).
4-3/4+3 NDVI Normalized Difference Vegetation Index; various ratios of TM bands 4:3 have proven useful for enhancing the contrast between vegetation types.
References for IKONOS satellite from Imtrat Corp., and USGS about Landsat TM (see references section for internet addresses)
Description of Arc View shapefiles:
Line features:
95h06rrl.shp - Roads
95h06irl.shp - indusctrial lines (seismic lines)
95h06hyl.shp - hydrography (streams)
Polygon features:
95h06hyr.shp - hydrography regions (lakes)
basin.shp - Scotty Cr. basin
(import to IDRISI as UTM projection, zone 10, NAD27)
all 95h06....shp files import to IDRISI as latlong and then PROJECT as UTM zone 10
Scotty Creek area B/W photographs in sets. Each set at different altitiudes
|