 |
|
|
|
|
|
|
|
|
|
|
|
|
|
|
|
|
|
|
|
|
|
|
|
|
|
|
|
|
|
|
|
|
|
|
|
|
|
 |
|
 |
 |
 |
|
 |
|
 |
 |
 |
|
 |
|
 |
There were many steps involved in the process of attempting to realize all of our project goals. These processes involved many different pieces of software at many different levels of census data. The following page describes the processes leading to our final working products including details about efficient ways to accomplish certain tasks. |
|
 |
 |
|
 |
|
 |
 |
 |
 |
|
 |
|
 |
 |
 |
Initially, the spatial census data was converted from an ArcInfo E00 format to ArcInfo coverages. ArcToolbox provides many useful tools for conversion of data, so this was a fairly simple process. Spatial relationships were then built using ArcView by creating spatial joins to identify associations between different geographic levels. The coverages were then exported into feature classes in the geodatabase. The census attribute data was found within the "Census Area Profiles" section of the Research Data Library. Variables were toggled with the 20/20 browser so full English names would be replaced by numbers. This change was made due to fact that Microsoft Access format or dBase |
 |
|
 |
|
 |
 |
 |
|
 |
|
 |
 |
|
 |
|
 |
 |
|
 |
|
 |
|
 |
|
 |
 |
 |
|
 |
|
 |
 |
 |
|
| format would support long field names. All geographic areal units (records) had to be toggled so that they would match the numbers in the spatial data. This process is seen in Figure 3.1, with all areal units to the left side. After this was complete, the conversion of attribute data began using a variety of methods. It was discovered that .csv and .dbf file formats provided efficiency and flexibility for the database. Although not easily edited once imported, .dbf files have the advantage of being able to be imported directly in ArcCatalog. Editing of the data is accomplished with greatest efficiency from within Ivation's 20/20 browser before download. As an alternative, editing can also be accomplished in Microsoft Access or Excel after downloading. However, one must be careful when editing dBase files in these two programs, since they tend to alter the data types. |
|
 |
|
| The most effective way for migrating the census data into a personal geodatabase was to convert the data from 20/20 into comma-separated value files. This involved the creation of a new table. The .csv file is then imported into a template which is then loaded into the the new table. The new table offers flexibility for setting data types and field names. |
|
 |
|
| Within a geodatabase, feature classes (spatial data) and the attribute data can be linked through a relationship class. The creation of these relationships benefits the end user by providing them with this important linkage information within ArcMap. Relationship classes were created with the ArcGIS package to structure the hierarchy of spatial aggregation within the census data. New fields had to be created in order to indicate which spatial levels the feature classes were related to. Within a Census Tract feature class, for example, a field is required to distinguish which Census Metropolitan Areas the CT belongs to. This was continued until all inherent census relationships were built, creating a true geodatabase. |
|
 |
|
 |
anchor |
 |
|
 |
 |
 |
|
 |
|
| As mentioned earlier, Visual Basic stood out as the most suitable environment for the design of our user census interface. Form scripts were written in Visual Basic for Applications (VBA) to create user selection menus based on our geodatabase regions and variables. Microsoft's ActiveX Data Objects (ADO) connection worked to facilitate connectivity from our designed VBA interface to the database. |
|
 |
|
| As you can see in Figure 3.2 and 3.3, the final interface product adds flexibility to our completed geodatabase. The end user can now specify a particular dataset to minimize wasted space, time and redundancy before analysis takes place. |
|
 |
|
 |
anchor |
 |
|
 |
 |
 |
|
 |
 |
|
| Arc Internet Map Server (IMS) is a powerful tool that was brought into our project to give the user yet another option in accessing our data. We have successfully created maps for every province at four levels of census agglomeration, with a few exceptions. All possible provinces were established as online maps at the Census Tract, with the FEDs and CMA depicted for the entire country. The Enumeration Areas (EA) were completed for all but three provinces - British Columbia, Ontario and Quebec. The sheer number of EAs in these provinces halted the IMS software from displaying them. Details on this problem are discussed in the Project Limitations section. |
|
 |
|
| ArcIMS was used to create various viewers at the FED, CMA, CT and EA levels. The following section will describe the exact steps taken by our group in developing a MapService for the province of British Columbia at the Census Tract level. The first step involved the creation of this census map was to add the data to the main view using one of four programs in the ArcIMS package, ArcIMS Author. Shapefiles, images, and ArcSDE coverages are compatible with the IMS viewer. Our spatial data was originally in shapefile form, and this is the |
 |
|
| data type for which it remained. Shapefiles were then added to the main map view, which is depicted in Figure 3.3. A color scheme was applied to the map and then scale dependent label renderers were added. These are text labels that show up as the user zooms into a relatively small scale. With our maps, a close enough zoom to any particular area will render an ID or name of census areas in the main view. After these scale dependent labels are added and a title is given the layer introduced, the map is ready to be "administered" with another component program called ArcIMS Administrator. |
|
 |
|
| The BC census tract map that we have just created is saved as an AXL file, which is also known as a map configuration file. An AXL file is made up of ArcXML code, ESRI's build of Extensible Markup Language and its function is to determine how the map will be rendered. An AXL file was created by saving our map in Author. This file is then "published" in ArcIMS Administrator, which is a program that controls how the IMS built site will operate by publishing the AXL files and managing spatial and virtual servers. If Ia site has high traffic, adding more spatial servers will allow more client requests to be handled. Figure 3.3 shows the main Administrator window where MapServices are published. |
 |
|
 |
|
| ArcIMS Designer is the third and final program used for the basic design of our BC Census Tract map. The fourth component of ArcIMS is "Manager," which integrates the other three components into a wizard-based program. The option to use Manager is often chosen for those who wish to establish a map on the Internet in a short period of time. Using Designer, the next step was to choose the tools that are to be available to the end user. We chose to include basic navigation options and tools to help users identify important census tract IDs that can be used for joining the spatial and attribute data. The tools included Identify, which allows the user to view specific polygon attributes. Another important tool that was included was MapTips, which is available in our |
|
| viewer because it is Java-enabled. This button allows the user to view specified data about a region by rolling their mouse over the polygon of choice. This allows users to quickly obtain data from the census maps, especially when working at the Enumeration Areas level, where there are thousands of polygons to view. The user may quickly switch between MapServices by using the custom open button that is available. Much customization was completed for the census maps, which will be discussed next. |
|
 |
|
| The software design structure of ArcIMS makes it easy for a given user to customize any component of the Java-based viewer which we originally created. Customizations were made in ArcXML, JavaScript and HTML in the form of script edits. Many customizations were done "on the fly" that cannot possibly be documented, but two good examples will be discussed to give a good idea of the possiblilties in ArcIMS. The first customization is seen in Figure 3.5, where a custom open button is created so it opens new MapServices via a website rather than the local system as is the default. |
|
 |
|
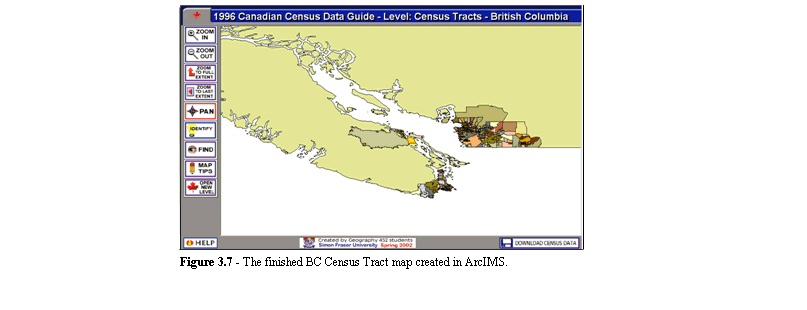
| This edit takes place in toolbar.htm, which is an ArcIMS viewer file that controls the toolbar portion of the ArcIMS viewer including some functionality. The next edit discussed here also takes place in toolbar.htm. Figure 3.6 depicts an edit made to enlarge toolbar buttons in order to provide a "clean" interface with easier navigation. The variable isSecond controls when a new column is created, and is normally set to null. These types of edits are made on a regular basis when designing an ArcIMS website to help the user access the data as quick as possible. The finalized MapService of BC Census Tracts is seen in Figure 3.7. |
|
 |
|
 |
 |
 |
 |
 |
 |
 |
 |
 |
 |
 |
 |
 |
 |
|
 |
|