Chapter Contents
Previous
Next
|
Chapter Contents |
Previous |
Next |
| PROBPLOT Statement |
| See CAPPROB4 in the SAS/QC Sample Library |
Measurements of the distance between two holes cut into 50 steel sheets are saved as values of the variable DISTANCE in the following data set:
   data sheets;
      input distance @@;
      label distance='Hole Distance in cm';
      datalines;
    9.80 10.20 10.27  9.70  9.76
   10.11 10.24 10.20 10.24  9.63
    9.99  9.78 10.10 10.21 10.00
    9.96  9.79 10.08  9.79 10.06
   10.10  9.95  9.84 10.11  9.93
   10.56 10.47  9.42 10.44 10.16
   10.11 10.36  9.94  9.77  9.36
    9.89  9.62 10.05  9.72  9.82
    9.99 10.16 10.58 10.70  9.54
   10.31 10.07 10.33  9.98 10.15
   ;
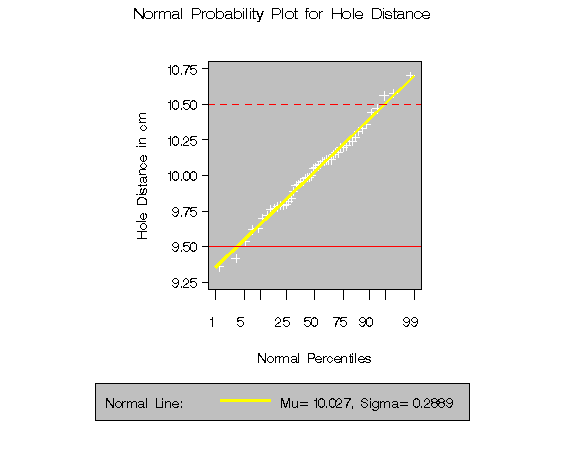
The cutting process is in control, and you decide to check whether the process distribution is normal. The following statements create a normal probability plot for DISTANCE with lower and upper specification lines at 9.5 cm and 10.5 cm:
   symbol v=dot height=3.5pct;
   legend2 frame cframe=ligr cborder=black position=center;
   title 'Normal Probability Plot for Hole Distance';

   proc capability data=sheets noprint;
      spec  lsl=9.5    llsl=1  clsl=red
            usl=10.5   lusl=2  cusl=red;
      probplot distance / normal(mu=est sigma=est color=yellow w=2)
                          square
                          nospeclegend
                          vaxis  = axis1
                          cframe = ligr
                          legend = legend2;
      axis1 label=(a=90 r=0);
   run;
The plot is shown in Output 9.1.1.
The MU= and SIGMA= normal-options request the diagonal
reference line that corresponds to the
normal distribution with estimated parameters
![]() and
and
![]() .The LSL= and USL= SPEC statement options request the
lower and upper specification lines,
and the LLSL=, LUSL=, CLSL=, and CUSL= options
specify the line types and colors.
The SYMBOL statement specifies the symbol marker
for the plotted points,
and the
AXIS1 statement specifies the angle and rotation for the
vertical axis label.
.The LSL= and USL= SPEC statement options request the
lower and upper specification lines,
and the LLSL=, LUSL=, CLSL=, and CUSL= options
specify the line types and colors.
The SYMBOL statement specifies the symbol marker
for the plotted points,
and the
AXIS1 statement specifies the angle and rotation for the
vertical axis label.
|
|
Chapter Contents |
Previous |
Next |
Top |
Copyright © 1999 by SAS Institute Inc., Cary, NC, USA. All rights reserved.