Chapter Contents
Previous
Next
|
Chapter Contents |
Previous |
Next |
| The REG Procedure |
   data acetyl;
      input x1-x4 @@;
      x1x2 = x1 * x2;
      x1x1 = x1 * x1;
      label x1  = 'reactor temperature(celsius)'
            x2  = 'h2 to n-heptone ratio'
            x3  = 'contact time(sec)'
            x4  = 'conversion percentage'
            x1x2= 'temperature-ratio interaction'
            x1x1= 'squared temperature';
      datalines;
   1300  7.5 .012 49   1300  9   .012  50.2 1300 11 .0115 50.5
   1300 13.5 .013 48.5 1300 17   .0135 47.5 1300 23 .012  44.5
   1200  5.3 .04  28   1200  7.5 .038  31.5 1200 11 .032  34.5
   1200 13.5 .026 35   1200 17   .034  38   1200 23 .041  38.5
   1100  5.3 .084 15   1100  7.5 .098  17   1100 11 .092  20.5
   1100 17   .086 29.5
   ;

   title 'Ridge Trace of Acetylene Data';
   symbol1 v=x        c=blue;
   symbol2 v=circle   c=yellow;
   symbol3 v=square   c=cyan;
   symbol4 v=triangle c=green;
   symbol5 v=plus     c=orange;
   legend2 position=(bottom right inside)
           across=3 cborder=black offset=(0,0)
           label=(color=blue position=(top center)
                  'independent variables') cframe=white;

   proc reg data=acetyl outvif
            outest=b ridge=0 to 0.02 by .002;
      model x4=x1 x2 x3 x1x2 x1x1/noprint;
      plot / ridgeplot nomodel legend=legend2 nostat
             vref=0 lvref=1 cvref=blue cframe=ligr;
   run;
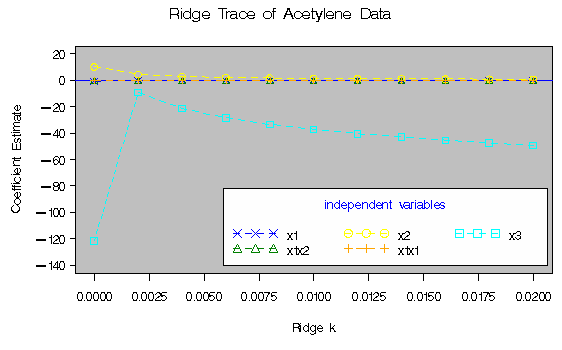
The results produced by the RIDGEPLOT option
are shown in Output 55.10.1. The OUTVIF option outputs the
variance inflation factors to the OUTEST= data set, which is used
in Example 55.11.
Output 55.10.1: Using the RIDEGPLOT Option for Ridge Regression

|
|
Chapter Contents |
Previous |
Next |
Top |
Copyright © 1999 by SAS Institute Inc., Cary, NC, USA. All rights reserved.