Chapter Contents
Previous
Next
|
Chapter Contents |
Previous |
Next |
| The REG Procedure |
data b (keep=_RIDGE_ x1-x3 x1x2 x1x1);
set b;
if _TYPE_='RIDGEVIF';
label x1='variance inflation factor';
run;
legend3 position=(top right inside) across=3
cborder=black cframe=white
label=(color=blue position=(top center)
'independent variables')
value=('X1' 'X2' 'X3' 'X1X2' 'X1X1');
symbol1 c=blue /*v=circle */;
symbol2 c=yellow /*v=x */;
symbol3 c=cyan /*v=triangle*/;
symbol4 c=green /*v=square */;
symbol5 c=orange /*v=diamond */;
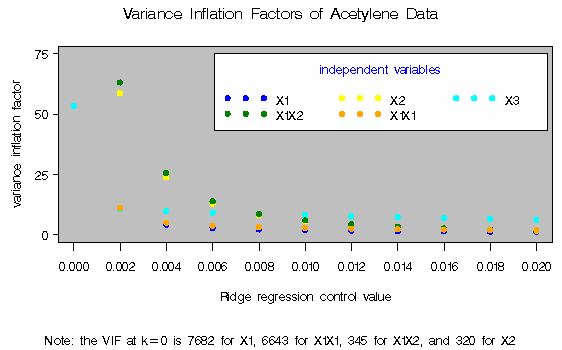
title 'Variance Inflation Factors of Acetylene Data';
proc reg data=b;
var _RIDGE_ x3 x1x2 x1x1;
model x1=x2 / noprint;
plot (x1 x2 x3 x1x2 x1x1)*_RIDGE_
/ nomodel nostat legend=legend3 overlay
vaxis = 0 to 75 by 25 cframe=ligr
haxis = 0 to .02 by .002;
footnote "Note: the VIF at k=0 is 7682 for X1, "
"6643 for X1X1, 345 for X1X2, and 320 for X2";
run;
The GPLOT procedure can create the same plot with the following statements. The resulting display is not shown in this report.
   axis1 label=(a=90 r=0 'variance inflation factor')
         order=(0 to 75 by 25) minor=none;
   proc gplot data=b;
      plot (x1 x2 x3 x1x2 x1x1)*_RIDGE_
           / legend=legend3 overlay frame
             vaxis = axis1
             haxis = 0 to .02 by .002 hminor=0;
      footnote "Note: the VIF at k=0 is 7682 for X1, "
               "6643 for X1X1, 345 for X1X2, and 320 for X2";
   run;
Output 55.11.1: Using PROC REG to Plot the VIFs
|
|
Chapter Contents |
Previous |
Next |
Top |
Copyright © 1999 by SAS Institute Inc., Cary, NC, USA. All rights reserved.