Mapping Frontier Economies
These four markets do not exist in isolation from one another. The economy as a whole is shaped by the collective demands of businesses across the four markets on the state, which determines government policy and, ultimately, whether the economy grows or stagnates. To understand that, you'll need to map the four markets in the economy.
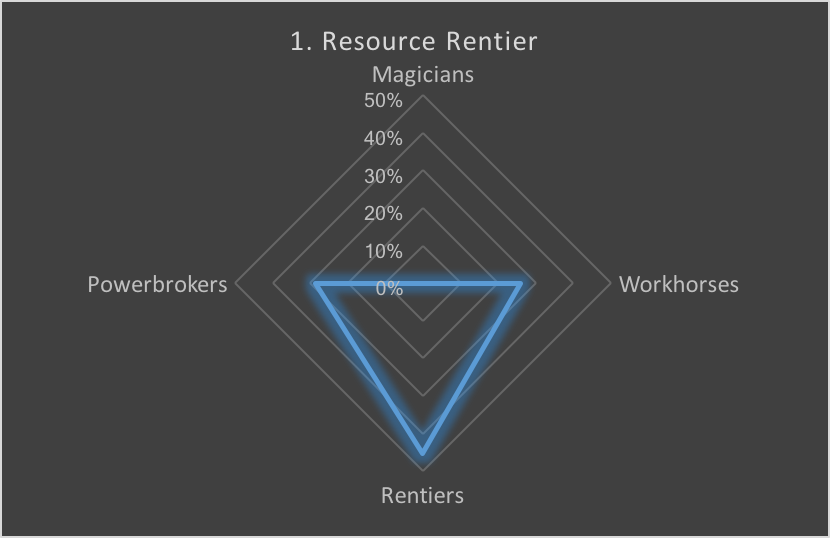
To map a frontier economy, estimate the share of value-added GDP being produced in different industries, and classify those industries according to whether they are rentiers, powerbrokers, workhorses, or clusters. Then, draw intersecting axes where the vertical axis is exports and the horizontal axis is domestic production. Excel's "radar" format works well, but any representation that can help your team visualize the political economy will do.
The vertical axis goes north to clusters and south to rentiers; the horizontal axis goes east to workhorses and west to powerbrokers. The SW axes are motivated by regulatory rents, the NE are motivated by market competition. Thus each row of the matrix above represents an axis; each column of the matrix represents a hemisphere.
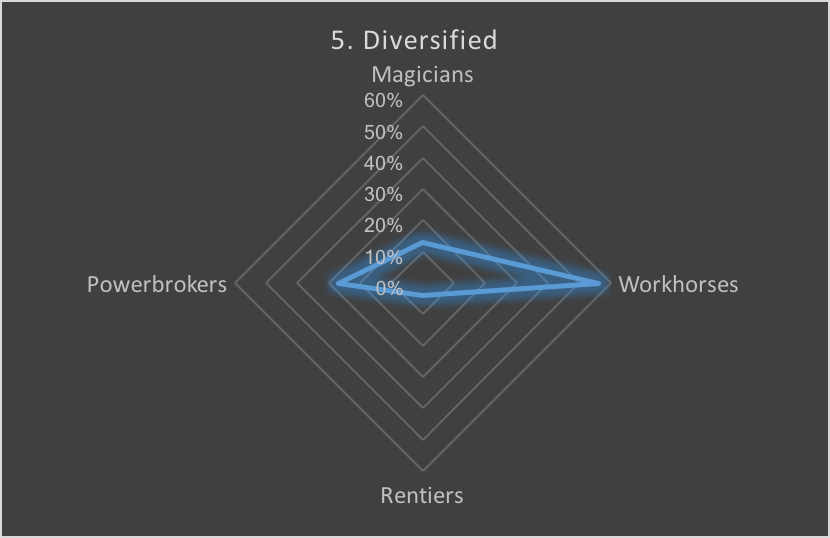
As it turns out, frontier economies usually fall into one of five distinct archetypes:
2.
3.
4.
5.