DATA COLLECTION
The following spatial data (shapefiles) and attribute data (Canada Census) were obtained from the SIS network under S: Drive’s Data Warehouse folder
| Data | Location |
| BC_UTM10n.shp | S:\Data Warehouse\BC |
| GVRD_muni.vct | S:\355-Data\Labs\Lab2 |
| GVRD_50m_DEM.shp | S:\Data Warehouse\DEMs\GVRD_50m_DEM |
| GVRD_lu_2001.shp | S:\Data Warehouse\GVRD Landuse |
| juststreet2.shp | S:\Data Warehouse\GVRD |
| bus exchange.shp | S:\Data Warehouse\Translink\Translink_2003\Exchanges |
| Sept_2001_All_Routes.shp | S:\Data Warehouse\Translink\Translink_2003\Sept 2001 Bus Routes |
| skytrain line.shp | S:\Data Warehouse\Translink\Translink_2003\SkyTrain |
| skytrain stations.shp | S:\Data Warehouse\Translink\Translink_2003\SkyTrain |
| age_da.dbf | S:\Data Warehouse\Canada Census\Canada 2001 Census\Vancouver CMA 2001 Profile Tables |
| inc_da.dbf | S:\Data Warehouse\Canada Census\Canada 2001 Census\Vancouver CMA 2001 Profile Tables |
| plac_da.dbf | S:\Data Warehouse\Canada Census\Canada 2001 Census\Vancouver CMA 2001 Profile Tables |
The following spatial data (shapefiles) were achieved by manually creating
point features on ArcMap. Google Map was used to determine the spatial locations
of the existing hospitals, libraries, and shopping centre. juststreet2.shp was
use as reference material to create point features on the shapefiles. Point
and polygon features were created using the Editor Tool in ArcMap.
• hospital.shp
• library.shp
• shopping_centre.shp
To complete the project, the below softwares were extensively used:
• ArcCatelog
• ArcMap
• Dreamweaver
• IDRISI
• Micsoft Paint
DATA MANIPULATION WITH ArcMap and IDRISI
Only the area of GVRD were kept from the BC_UTM10n.shp, making it the base map (called BC_UTM10n_basemap.shp) of the project. The attributes table of the base map and the Census data are then joined (field DAUID), and exported into thematic map shapefiles. The following shapefiles with Census data were created:
• employment_rate.shp

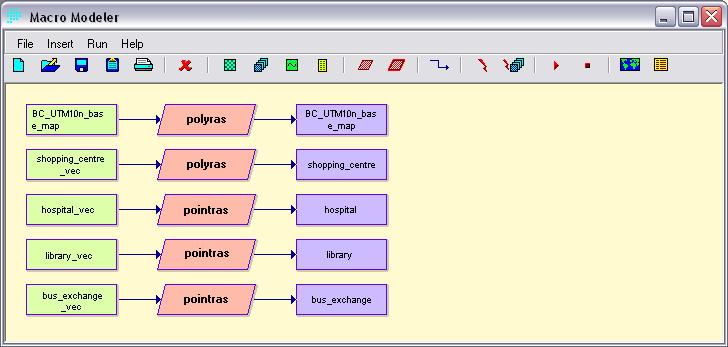
These shapefiles were projected into UTM 10N reference system and imported into IDRISI using the SHAPEIDR module.
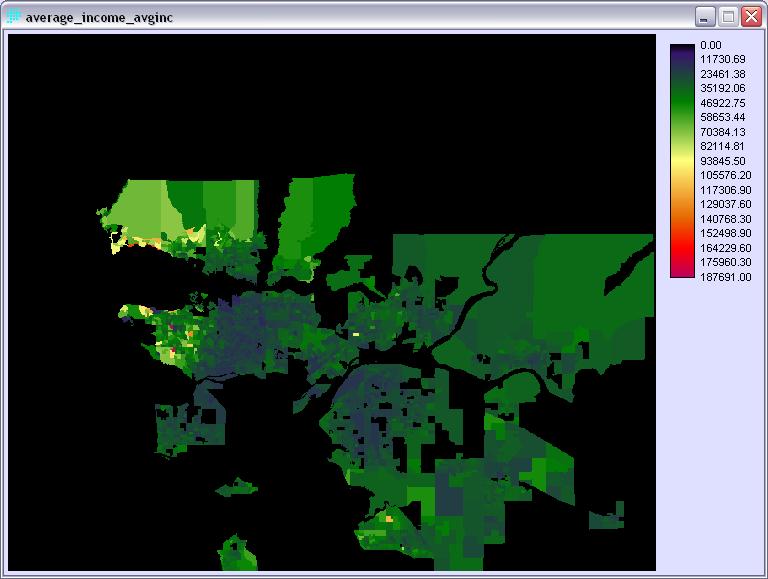
After the Census maps were imported into IDRISI as vector images. Desired field (employment rate, average income, total population, transit users) of each image was selected and used to create a new raster image.
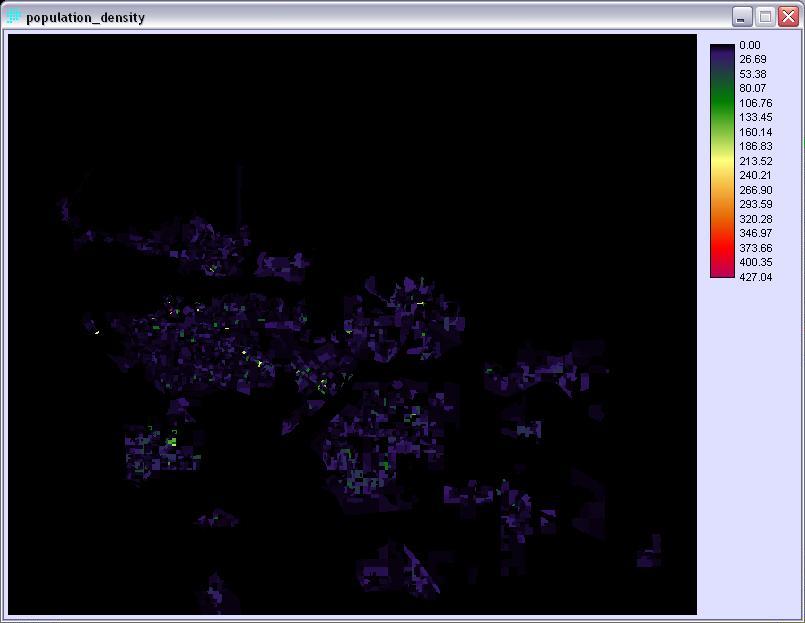
Image Calculator was used to calculate the population density. Mathematical expression was selected with the following equation:
population_density = [total_population_totpop]/[total_population_totpop_area]
where
• total_population_totpop
= raster image of total population
• total_population_totp_area
= raster image of area created using AREA module
Spatial shapefiles were projected into the UTM 10N reference system as well
and then imported into IDRISI through the SHAPEIDR module. These vector images
were then converted to raster format using RASTERVECTOR module.